使用网络视图 (Network View)
How to use the DevTools network view.
网络视图是什么?
#你可以通过网络视图检查来自 Dart 或 Flutter 应用程序的 HTTP、HTTPS 和 WebSocket 的网络流量情况。
记录哪些网络流量?
#
所有来自 dart:io(如 HttpClient
类)的网络流量都会被记录,包括 dio package。此外,所有使用 http_profile
package 记录的网络流量也会记录在网络请求表中,这包括来自 cupertino_http、
cronet_http
和 ok_http package 的网络流量。
对于使用浏览器发起请求的 Web 应用,我们建议使用浏览器工具(例如 Chrome DevTools)来检查网络流量。
如何使用
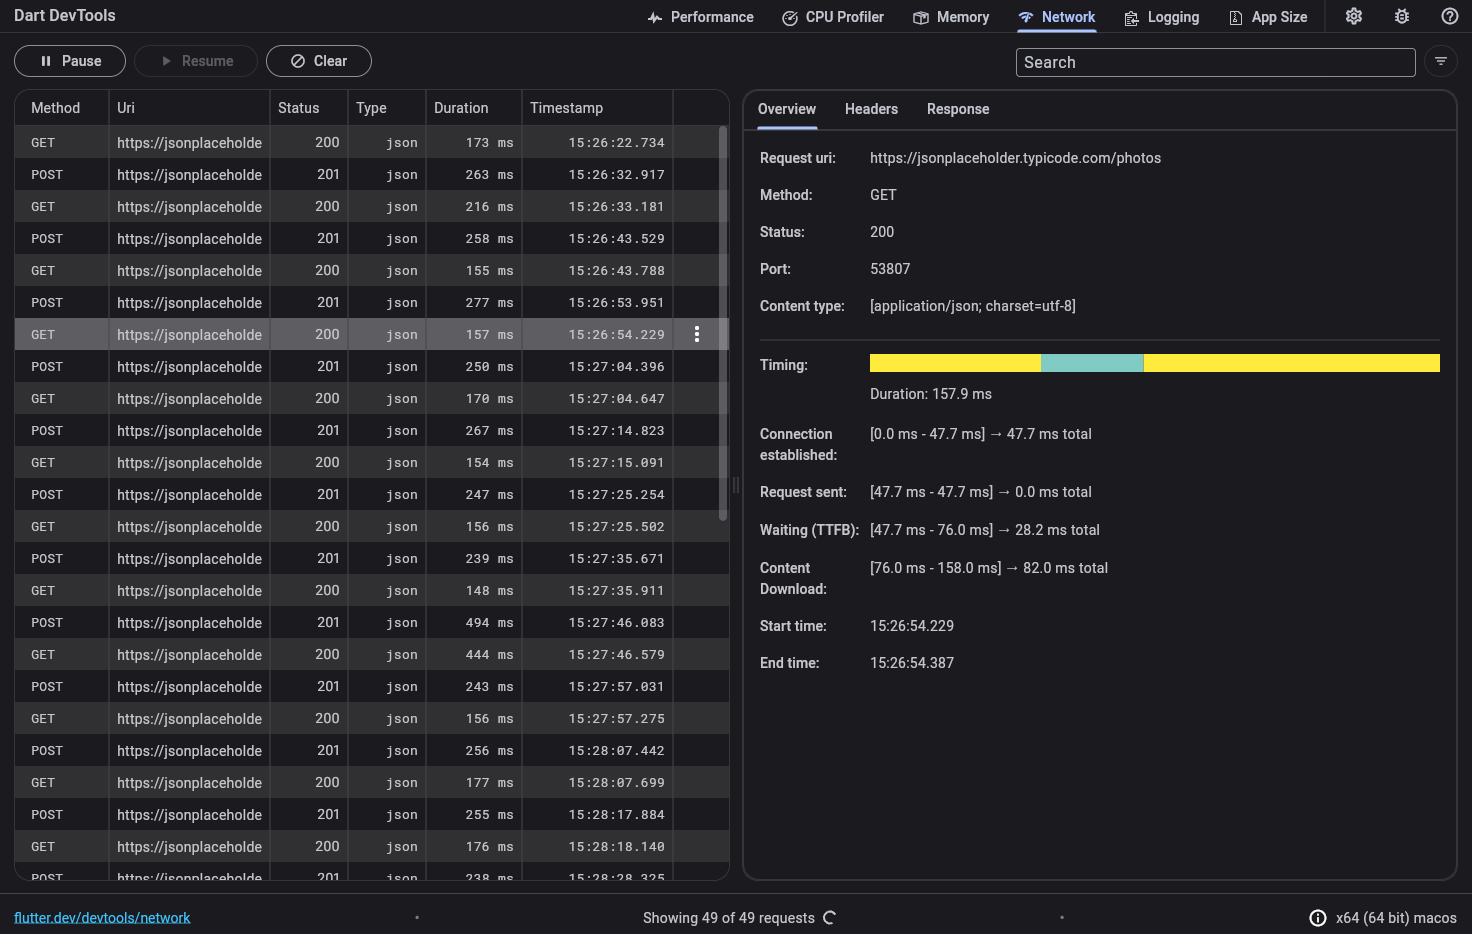
#当你打开网络视图页面后,DevTools 会立即开始记录网络流量。请使用 Pause 和 Resume 按钮(左上角)来暂停和继续记录网络流量。
当你的应用发送网络请求时,他会出现在网络请求表(左边)中。在该请求收到完整的响应之前,该请求将被列为 "Pending"。
从表格中选中一个网络请求(左边)来查看请求细节(右边)。你可以检查关于请求的常规信息和时间信息,包含响应内容、请求标头、请求体。在收到响应之前,有些数据是不可用的。
搜索和过滤
#你可以使用搜索和过滤来寻找一个特定的请求,或者单独在请求表中过滤请求。

要使用过滤器,请点击过滤器按钮(搜索栏右边)。你会看见一个过滤查询对话框弹出:
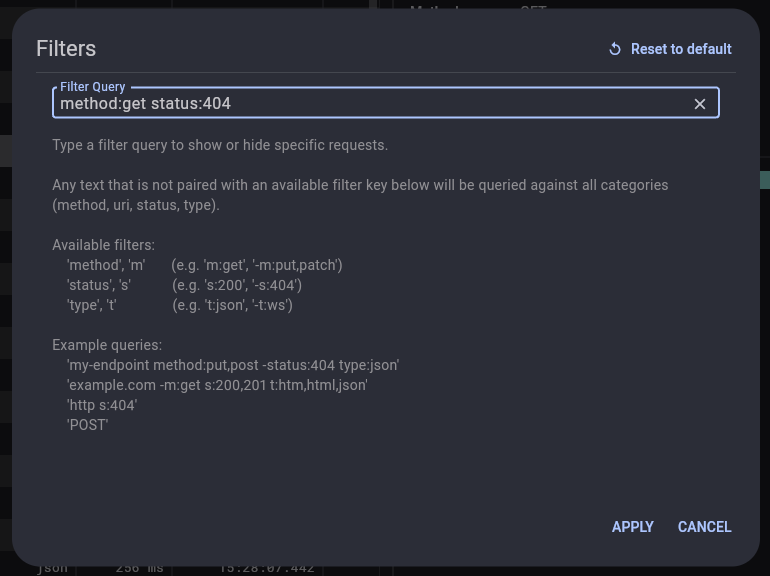
过滤查询的语法在对话框中描述。你可以通过以下语法关键词来过滤网络请求:
-
method,m:该关键词对应过滤 “Method” 列中的值 -
status,s:该关键词对应过滤 “Status” 列中的值 -
type,t:该关键词对应过滤 “Type” 列中的值
任何没有与可用的语法关键词对应的文本将会查询所有类别 (method、URI、status、type)。
过滤器查询示例:
my-endpoint m:get t:json s:200
https s:404
在应用启动时记录网络请求
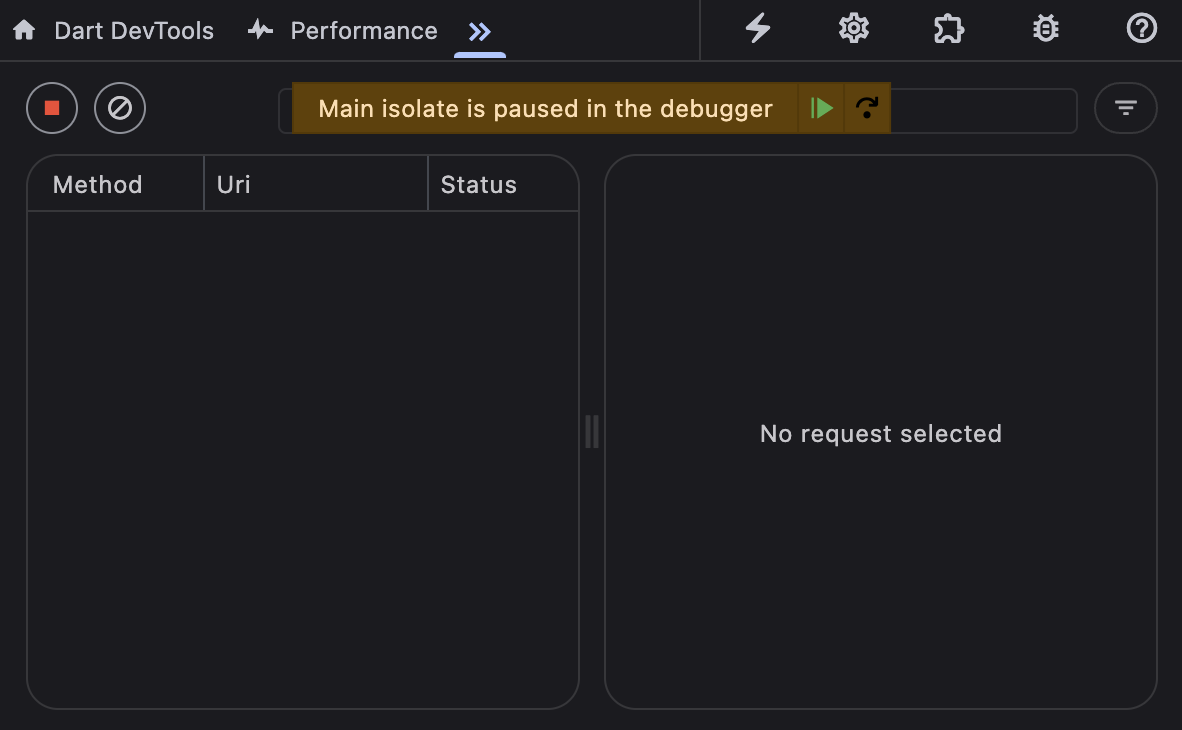
#要在应用启动时记录网络流量,你可以先以暂停状态启动应用,然后在 DevTools 中开始记录网络流量,之后再恢复应用。
-
以暂停状态启动应用:
flutter run --start-paused ...dart run --pause-isolates-on-start --observe ...
-
从启动应用的 IDE 打开 DevTools;若从 CLI 启动应用,则从打印到命令行的链接打开。
-
导航到 Network(网络)界面,确保已开始记录。
-
恢复应用。
-
网络分析器现在会记录应用的所有网络流量,包括应用启动时的流量。
其他信息
#
HTTP 和 HTTPs 请求也作为异步时间线事件出现在 时间线 (Timeline)
中。如果你想了解 HTTP 流量情况与应用程序或 Flutter 框架中发生的其他事件是否一致,这种情况下在时间线中查看网络活动是很有用的。
要学习如何使用 DevTools 监控应用程序的网络流量以及检查不同类型的请求,请查阅 网络视图教程。该教程还使用网络视图来识别导致应用程序性能不佳的网络活动。
除非另有说明,本文档之所提及适用于 Flutter 3.44.0 版本。本页面最后更新时间:2026-06-16。查看文档源码 或者 为本页面内容提出建议。