# Visual Studio Code
> 如何在 VS Code 里开发 Flutter 应用。
## Installation and setup {: #setup}
## 安装和配置
[VS Code][] is a code editor to build and debug apps.
With the Flutter extension installed, you can compile, deploy, and debug
Flutter apps.
[VS Code][] 是一款用于构建和调试应用的代码编辑器。
安装 Flutter 扩展后,你可以编译、部署和调试 Flutter 应用。
To install the latest version of VS Code,
follow Microsoft's instructions for the relevant platform:
要安装最新版本的 VS Code,
请按照微软针对相关平台的说明进行安装:
- [在 macOS 上安装][Install on macOS]
- [在 Windows 上安装][Install on Windows]
- [在 Linux 上安装][Install on Linux]
[VS Code]: https://code.visualstudio.com/
[Install on macOS]: https://code.visualstudio.com/docs/setup/mac
[Install on Windows]: https://code.visualstudio.com/docs/setup/windows
[Install on Linux]: https://code.visualstudio.com/docs/setup/linux
### Install the Flutter extension {: #install-extension}
### 安装 Flutter 扩展
1. Start **VS Code**.
启动 **VS Code**。
1. Open a browser and go to the [Flutter extension][] page
on the Visual Studio Marketplace.
打开浏览器,进入 Visual Studio Marketplace 上的 [Flutter extension][] 页面。
1. Click **Install**.
Installing the Flutter extension also installs the Dart extension.
点击 **Install**。
安装 Flutter 扩展的同时也会安装 Dart 扩展。
[Flutter extension]: https://marketplace.visualstudio.com/items?itemName=Dart-Code.flutter
### Validate your VS Code setup {: #validate-setup}
### 验证 VS Code 配置
1. Go to **View** >
**Command Palette...**.
打开 **View** >
**Command Palette...**。
You can also press Ctrl / Cmd +
Shift + P.
你也可以使用快捷键:Ctrl / Cmd +
Shift + P。
1. Type `doctor`.
输入 `doctor`。
1. Select **Flutter: Run Flutter Doctor**.
选择 **Flutter: Run Flutter Doctor**。
Once you select this command, VS Code does the following:
当你选择该命令后,VS Code 会执行以下操作:
- Opens the **Output** panel.
打开 **Output** 面板。
- Displays **flutter (flutter)** in the dropdown on the upper right
of this panel.
在此面板右上方的下拉菜单中显示 **flutter (flutter)**。
- Displays the output of `flutter doctor` command.
显示 `flutter doctor` 命令的输出结果。
### Updating the extension {:#updating}
### 更新扩展程序
Updates to the extensions are shipped on a regular basis.
By default, VS Code automatically updates extensions when
updates are available.
扩展的更新会定期发布。
默认情况下,当有可用的更新时 VS Code 会自动更新扩展。
To install updates yourself:
手动安装更新:
1. Click **Extensions** in the Side Bar.
点击侧边栏的 **Extensions** 按钮。
1. If the Flutter extension has an available update,
click **Update** and then **Reload**.
如果 Flutter 扩展显示有可用更新,点击更新按钮,然后重载。
1. Restart VS Code.
重启 VS Code。
## Creating projects
## 创建项目
There are a couple ways to create a new project.
有几种方式创建一个新项目。
### Creating a new project
### 新建项目
To create a new Flutter project from the Flutter
starter app template:
通过 Flutter 入门应用模板新建 Flutter 项目:
1. Go to **View** >
**Command Palette...**.
打开 **View** >
**Command Palette...**。
You can also press Ctrl / Cmd +
Shift + P.
你也可以按下 Ctrl / Cmd +
Shift + P。
1. Type `flutter`.
输入 `flutter`。
1. Select the **Flutter: New Project**.
选择 **Flutter: New Project** 命令。
1. Press Enter.
按下 Enter。
1. Select **Application**.
选择 **Application**。
1. Press Enter.
按下 Enter。
1. Select a **Project location**.
选择 **项目地址**。
1. Enter your desired **Project name**.
输入你想要的 **项目名**。
### Opening a project from existing source code
### 从现有源代码打开项目
To open an existing Flutter project:
打开一个现有的 Flutter 项目:
1. Go to **File** > **Open**.
打开 **File** > **Open**。
You can also press Ctrl / Cmd + O
你也可以按下 Ctrl / Cmd + O。
1. Browse to the directory holding your existing
Flutter source code files.
浏览到存放你现有 Flutter 源代码文件的目录。
1. Click **Open**.
点击 **Open**。
## Editing code and viewing issues
## 编写代码及查看问题
The Flutter extension performs code analysis.
The code analysis can:
Flutter 扩展执行代码分析,它提供:
- Highlight language syntax
语法高亮。
- Complete code based on rich type analysis
基于丰富输入分析的代码补全。
- Navigate to type declarations
导航到类型声明(**Go to Definition** 或 `F12`)
- Go to **Go** > **Go to Definition**.
前往 **Go** > **Go to Definition**。
- You can also press F12.
你也可以按下 F12。
- Find type usages.
查找类型引用
- Press Shift + F12.
按下 Shift + F12。
- View all current source code problems.
查看所有当前代码问题
- Go to **View** > **Problems**.
前往 **View** > **Problems**。
- You can also press Ctrl / Cmd +
Shift + M.
你也可以按下 Ctrl / Cmd +
Shift + M。
- The Problems pane displays any analysis issues:

所有问题分析都会在 Problems 面板展示:
{:.mw-100 .pt-1}
## Running and debugging
## 运行和调试
:::note
You can debug your app in a couple of ways.
有多种方式能够调试你的应用
- Using [DevTools][], a suite of debugging and profiling
tools that run in a browser.
使用 [DevTools][],它是一个运行在浏览器中的
调试以及性能测试工具集。
- Using VS Code's built-in debugging features,
such as setting breakpoints.
使用 VS Code 的内置调试功能,例如设置断点。
The instructions below describe features available in VS Code.
For information on launching and using DevTools, see
[Running DevTools from VS Code][] in the [DevTools][] docs.
以下说明描述了 VS Code 可用的功能。更多启动和使用 DevTools 的详细信息请参考
[DevTools][] 文档中的 [在 VS Code 中运行 DevTools][Running DevTools from VS Code]。
:::
Start debugging by clicking **Run > Start Debugging**
from the main IDE window, or press F5.
在 IDE 主窗口点击 **Run > Start Debugging** 或按 `F5` 开启调试。
### Selecting a target device
### 选择目标设备
When a Flutter project is open in VS Code,
you should see a set of Flutter specific entries in the status bar,
including a Flutter SDK version and a
device name (or the message **No Devices**):
当一个 Flutter 项目在 VS Code 中打开,
你会在状态栏看到一些 Flutter 特有项,
包括 Flutter SDK 版本和设备名称(或者 **无设备** 信息):
![VS Code status bar][]
:::note
- If you do not see a Flutter version number or device info,
your project might not have been detected as a Flutter project.
Ensure that the folder that contains your `pubspec.yaml` is
inside a VS Code **Workspace Folder**.
如果你没看到 Flutter 版本号或者设备信息,
你的项目可能不被识别为一个 Flutter 项目。
请确认 VS Code **Workspace Folder** 的目录中是否含有 `pubspec.yaml`。
- If the status bar reads **No Devices**, Flutter has not been
able to discover any connected iOS or Android devices or simulators.
You need to connect a device, or start a simulator or emulator,
to proceed.
如果状态栏显示 **无设备** 表明 Flutter
没有发现任何已连接的 IOS、Android 或者模拟器。
你需要连接设备或者启动模拟器。
:::
The Flutter extension automatically selects the last device connected.
However, if you have multiple devices/simulators connected, click
**device** in the status bar to see a pick-list
at the top of the screen. Select the device you want to use for
running or debugging.
Flutter 扩展会自动选择上次连接的设备。
然而,如果你有多个设备/模拟器连接,
点击状态栏的 **device** 查看屏幕顶部的选择列表。
选择你要用来运行或调试的设备。
:::secondary
**Are you developing for macOS or iOS remotely using
Visual Studio Code Remote?** If so, you might need to manually
unlock the keychain. For more information, see this
[question on StackExchange][].
**你是否使用 VSCode Remote 远程开发 macOS 或 iOS 应用?**
如果是,你可能需要手动解锁 iOS 密钥。
更多信息请查看 [StackExchange 上的问题解答][question on StackExchange]。
:::
[question on StackExchange]: https://superuser.com/questions/270095/when-i-ssh-into-os-x-i-dont-have-my-keychain-when-i-use-terminal-i-do/363840#363840
### Run app without breakpoints
### 无断点运行
Go to **Run** > **Start Without Debugging**.
在 IDE 主窗口点击 **Run > Start Without Debugging**。
You can also press Ctrl + F5.
或者按 Ctrl + F5。
### Run app with breakpoints
### 断点运行
1. If desired, set breakpoints in your source code.
如果需要,在源代码中设置断点。
1. Click **Run** > **Start Debugging**.
You can also press F5.
The status bar turns orange to show you are in a debug session.
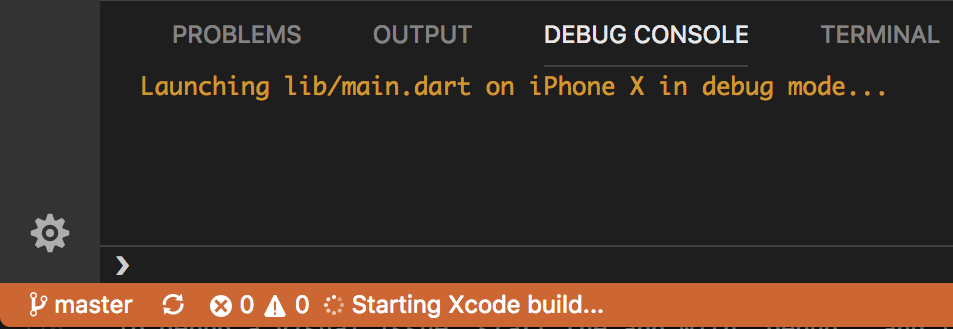
在 IDE 主窗口点击 **Run > Start Debugging** 或按 `F5`。
{:.mw-100 .pt-1}
- The left **Debug Sidebar** shows stack frames and variables.
左侧的**调试侧边栏**显示堆栈帧和变量。
- The bottom **Debug Console** pane shows detailed logging output.
底部的**调试控制台**面板显示输出的日志详情。
- Debugging is based on a default launch configuration.
To customize, click the cog at the top of the
**Debug Sidebar** to create a `launch.json` file.
You can then modify the values.
调试基于默认的配置。
也可以通过点击**调试侧边栏**顶部的齿轮创建 `launch.json` 文件自定义调试。
你可以修改里面的值。
### Run app in debug, profile, or release mode
### 以 调试 (debug)、性能 (profile) 或发布 (release) 模式运行应用
Flutter offers many different build modes to run your app in.
You can read more about them in [Flutter's build modes][].
Flutter 提供了很多种不同的构建模式运行你的应用,
更多内容请参考文档 [Flutter 的构建模式][Flutter's build modes]。
1. Open the `launch.json` file in VS Code.
打开 VS Code 里的 `launch.json` 文件
If you don't have a `launch.json` file:
如果你没有 `launch.json` 文件。
{: type="a"}
1. Go to **View** > **Run**.
前往 **View** > **Run**。
You can also press Ctrl / Cmd +
Shift + D
你也可以按下 Ctrl / Cmd +
Shift + D。
The **Run and Debug** panel displays.
**Run and Debug** 面板会展示。
1. Click **create a launch.json file**.
点击 **create a launch.json file** 创建。
1. In the `configurations` section,
change the `flutterMode` property to
the build mode you want to target.
在 `configurations` 部分,修改 `flutterMode` 属性值为你想要的构建模式即可。
For example, if you want to run in debug mode,
your `launch.json` might look like this:
举个例子,如果你希望在调试模式下运行,
你的 `launch.json` 文件应该类似下面这样:
```json
"configurations": [
{
"name": "Flutter",
"request": "launch",
"type": "dart",
"flutterMode": "debug"
}
]
```
1. Run the app through the **Run** panel.
通过 **Run** 面板运行你的应用。
## Fast edit and refresh development cycle
## 快速编辑和刷新开发周期
Flutter offers a best-in-class developer cycle enabling you
to see the effect of your changes almost instantly with the
_Stateful Hot Reload_ feature.
To learn more, check out [Hot reload][].
Flutter 为开发者提供了一流的开发体验,通过 **有状态的热重载**
特性使你在几乎修改代码的同时就能看到变化。
详情请看 [使用热重载][Hot reload]。
## Advanced debugging
## 进阶调试
You might find the following advanced debugging tips useful:
以下的调试指南可能会对你有帮助:
### Debugging visual layout issues
### 可视化布局问题调试
During a debug session,
several additional debugging commands are added to the
[Command Palette][] and to the [Flutter inspector][].
When space is limited, the icon is used as the visual
version of the label.
在调试会话期间,[命令面板][Command Palette] 和 [Flutter inspector][]
会添加一些额外的调试命令。当空间有限时,会使用图标作为标签的可视化形式。
**Toggle Baseline Painting** {:.theme-icon width="20px"}
Causes each RenderBox to paint a line at each of its baselines.
**切换 Baseline 绘制** {:.theme-icon width="20px"}
每个 RenderBox 在底部绘制一条线。
**Toggle Repaint Rainbow** {:.theme-icon width="20px"}
Shows rotating colors on layers when repainting.
**切换重绘 Rainbow** {:.theme-icon width="20px"}
重新绘制时在图层上改变颜色。
**Toggle Slow Animations** {:.theme-icon width="20px"}
Slows down animations to enable visual inspection.
**切换慢模式横幅** {:.theme-icon width="20px"}
减慢动画以启用视觉检查。
**Toggle Debug Mode Banner** {:width="20px"}
Hides the debug mode banner even when running a debug build.
**切换 debug 模式横幅显示** {:width="20px"}
在运行调试构建时隐藏 debug 模式的横幅 (banner)。
### Debugging external libraries
### 调试外部库
By default, debugging an external library is disabled
in the Flutter extension. To enable:
默认情况下,Flutter 扩展禁止调试外部库。启用步骤:
1. Select **Settings > Extensions > Dart Configuration**.
选择 **Settings > Extensions > Dart Configuration**
2. Check the `Debug External Libraries` option.
勾选 `Debug External Libraries` 选项。
## Editing tips for Flutter code
## Flutter 代码编辑提示
If you have additional tips we should share, [let us know][]!
如果你有其他我们应该提供的代码提示建议,请 [告诉我们][let us know]!
### Assists & quick fixes
### 代码辅助和快速修复
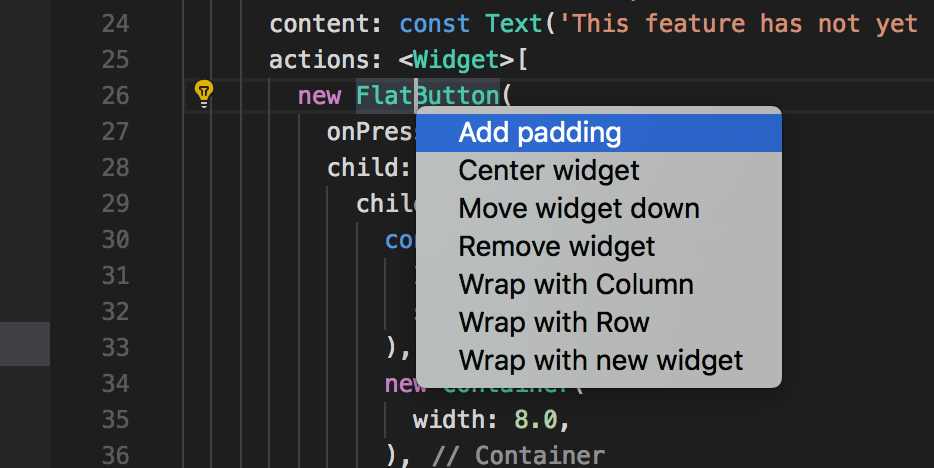
Assists are code changes related to a certain code identifier.
A number of these are available when the cursor is placed on a
Flutter widget identifier, as indicated by the yellow lightbulb icon.
To invoke the assist, click the lightbulb as shown in the following screenshot:
代码辅助功能是特定代码标识符相关的代码修改。
当光标放在 Flutter widget 标识符上时,黄色灯泡图标会指示可用的修改。
要调用代码辅助,点击灯泡,如下图所示:
{:width="467px"}
You can also press Ctrl / Cmd + .
你也可以按下 Ctrl / Cmd + .。
Quick fixes are similar,
only they are shown with a piece of code has an error and they
can assist in correcting it.
快速修复跟辅助类似,当一段代码有错误并且可以辅助修正时才会显示。
**Wrap with new widget assist**
**Widget 嵌套辅助**
This can be used when you have a widget that you want to wrap
in a surrounding widget, for example if you want to wrap a
widget in a `Row` or `Column`.
当你有个 widget 想包装进一个容器 widget 时,
例如你想把 widget 放入一个 `Row` 或者 `Column`。
**Wrap widget list with new widget assist**
**Widget 列表嵌套辅助**
Similar to the assist above, but for wrapping an existing
list of widgets rather than an individual widget.
和上面的辅助类似,但它嵌套的是一个 widget 的列表,
而不是单个的 widget。
**Convert child to children assist**
**child 和 children 转换辅助**
Changes a child argument to a children argument,
and wraps the argument value in a list.
将 child 转换成 children,并且把参数值写进一个 list。
**Convert StatelessWidget to StatefulWidget assist**
Changes the implementation of a `StatelessWidget` to that of
a `StatefulWidget`, by creating the `State` class and moving
the code there.
**StatelessWidget 到 StatefulWidget 的转换**
创建 `State` 类并将代码移动过去,
可以将 `StatelessWidget` 的实现更改为 `StatefulWidget`。
### Snippets
### 代码片段
Snippets can be used to speed up entering typical code structures.
They are invoked by typing their prefix,
and then selecting from the code completion window:
代码片段可以用来加速输入通用类型代码段。
通过输入前缀来调用,然后从代码完成窗口中选择:
{:width="100%"}
The Flutter extension includes the following snippets:
Flutter 扩展包括以下片段:
- Prefix `stless`: Create a new subclass of -StatelessWidget`.
前缀 `stless`:创建一个 `StatelessWidget` 子类。
- Prefix `stful`: Create a new subclass of `StatefulWidget`
and its associated State subclass.
前缀 `stful`:创建一个 `StatefulWidget` 子类,并且和 State 子类关联。
- Prefix `stanim`: Create a new subclass of `StatefulWidget`,
and its associated State subclass including a field initialized
with an `AnimationController`.
前缀 `stanim`:创建一个 `StatefulWidget` 子类,并且把包含字段初始化的 State 子类和一个 `AnimationController` 关联。
The Dart extension includes the following snippets:
Dart 扩展包括以下片段:
| Prefix前缀 | Description描述 | Code Example代码示例 |
|---|---|---|
| `main` | Insert a main function, used as an entry point. | `void main(List args) { }` |
| `main` | 插入一个 main 函数,用作入口点。 | `void main(List args) { }` |
| `try` | Insert a try/catch block. | `try { } catch (e) { }` |
| `try` | 插入一个 try/catch 块。 | `try { } catch (e) { }` |
| `if` | Insert an if statement. | `if (condition) { }` |
| `if` | 插入一个 if 语句。 | `if (condition) { }` |
| `ife` | Insert an if statement with an else block. | `if (condition) { } else { }` |
| `ife` | 插入一个带有 else 块的 if 语句。 | `if (condition) { } else { }` |
| `switch` | Insert a switch statement. | `switch (variable) { case value1: break; case value2: break; default: }` |
| `switch` | 插入一个 switch 语句。 | `switch (variable) { case value1: break; case value2: break; default: }` |
| `for` | Insert a for loop. | `for (var i = 0; i < 10; i++) { }` |
| `for` | 插入一个 for 循环。 | `for (var i = 0; i < 10; i++) { }` |
| `fori` | Insert a for-in loop. | `for (var item in list) { }` |
| `fori` | 插入一个 for-in 循环。 | `for (var item in list) { }` |
| `while` | Insert a while loop. | `while (condition) { }` |
| `while` | 插入一个 while 循环。 | `while (condition) { }` |
| `do` | Insert a do-while loop. | `do { } while (condition);` |
| `do` | 插入一个 do-while 循环。 | `do { } while (condition);` |
| `fun` | Insert a function definition. | `void myFunction(String name) { }` |
| `fun` | 插入一个函数定义。 | `void myFunction(String name) { }` |
| `class` | Insert a class definition. | `class MyClass { }` |
| `class` | 插入一个类定义。 | `class MyClass { }` |
| `typedef` | Insert a typedef. | `typedef MyFunction = void Function(String);` |
| `typedef` | 插入一个 typedef。 | `typedef MyFunction = void Function(String);` |
| `test` | Insert a test block. | `test('My test description', () { });` |
| `test` | 插入一个 test 块。 | `test('My test description', () { });` |
| `group` | Insert a test group block. | `group('My test group', () { });` |
| `group` | 插入一个 test group 块。 | `group('My test group', () { });` |
You can also define custom snippets by executing
**Configure User Snippets** from the [Command Palette][].
你也可以通过在 [命令面板][Command Palette]
执行 **Configure User Snippets** 来自定义片段。
### Keyboard shortcuts
### 键盘快捷键
**Hot reload**
To perform a hot reload during a debug session,
click **Hot Reload** on the **Debug Toolbar**.
**热重载 (Hot Reload)**
调试期间,在 **调试工具栏** 点击 **热重载 (Hot Reload)** 按钮。
You can also press Ctrl + F5
(Cmd + F5 on macOS).
你也可以按下 Ctrl + F5
(macOS 为 Cmd + F5)。
Keyboard mappings can be changed by executing the
**Open Keyboard Shortcuts** command from the [Command Palette][].
键位绑定可以在 [命令面板][Command Palette] 中使用
**Open Keyboard Shortcuts** 命令进行调整。
### Hot reload vs. hot restart
### 热重载和热重启
Hot reload works by injecting updated source code files into the
running Dart VM (Virtual Machine). This includes not only
adding new classes, but also adding methods and fields to
existing classes, and changing existing functions.
A few types of code changes cannot be hot reloaded though:
热重载的工作原理是将更新后的代码注入 Dart VM(虚拟机)。
不仅包括添加新类,还包括添加方法和字段到已有的类中。
但有些类型的代码是无法被热重载的:
- Global variable initializers
全局变量的初始化
- Static field initializers
静态变量的初始化
- The `main()` method of the app
应用的 `main()` 方法
For these changes, restart your app without
ending your debugging session. To perform a hot restart,
run the **Flutter: Hot Restart** command from the [Command Palette][].
对于这些更改,你无需结束调试过程而直接热重启 (hot restart) 你的应用。
要执行热重启,执行 [命令面板][Command Palette] 的 **Flutter:Hot Restart** 命令。
You can also press
Ctrl + Shift + F5
or Cmd + Shift + F5 on macOS.
你也可以按下 Ctrl + Shift + F5
(在 macOS 上使用 Cmd + Shift + F5)。
### Customize closing labels {: #closing-labels}
### 自定义闭合标签
The Dart extension displays labels after
the closing delimiters of multi-line constructs, such as
constructor invocations, method calls, and list literals.
Closing labels are editor annotations and don't change your source code,
even though the default ` // ` prefix makes them look similar to comments.
Dart 扩展会在多行结构(如构造函数调用、方法调用和列表)的闭合分隔符后显示标签。
尽管默认的 ` // ` 前缀使其看起来与注释相似,
闭合标签是编辑器行为的注释,不会更改你的源代码。
To change the prefix:
如果要更改前缀:
1. Open the [Command Palette][].
打开 [命令面板][Command Palette]。
1. Select **Preferences: Open Settings (UI)**.
选择 **Preferences: Open Settings (UI)(首选项:打开设置 (UI))**。
1. Search for `dart.closingLabels`.
搜索 `dart.closingLabels`。
1. In **Dart: Closing Labels Prefix**, enter your preferred prefix.
在 **Dart: Closing Labels Prefix** 中,输入你偏好的前缀。
For example, to remove the comment marker while
keeping space between the code and label,
set the prefix to a single space (` `):
例如,若要删除注释标记,
同时保留代码与标签之间的空格,
请将前缀设置为一个空格 (` `):
```json
{
"dart.closingLabelsPrefix": " "
}
```
To hide closing labels, turn off **Dart: Closing Labels**.
For the complete list of closing label options,
see the [extension's settings reference][closing-label-options].
若要隐藏闭合标签,请关闭 **Dart: Closing Labels**。
有关于闭合标签选项的完整列表,
请查阅 [扩展设置参考][closing-label-options]。
[closing-label-options]: https://dartcode.org/docs/settings/#dartclosinglabels
## Flutter Property Editor {: #property-editor}
## Flutter 属性编辑器 (Property Editor)
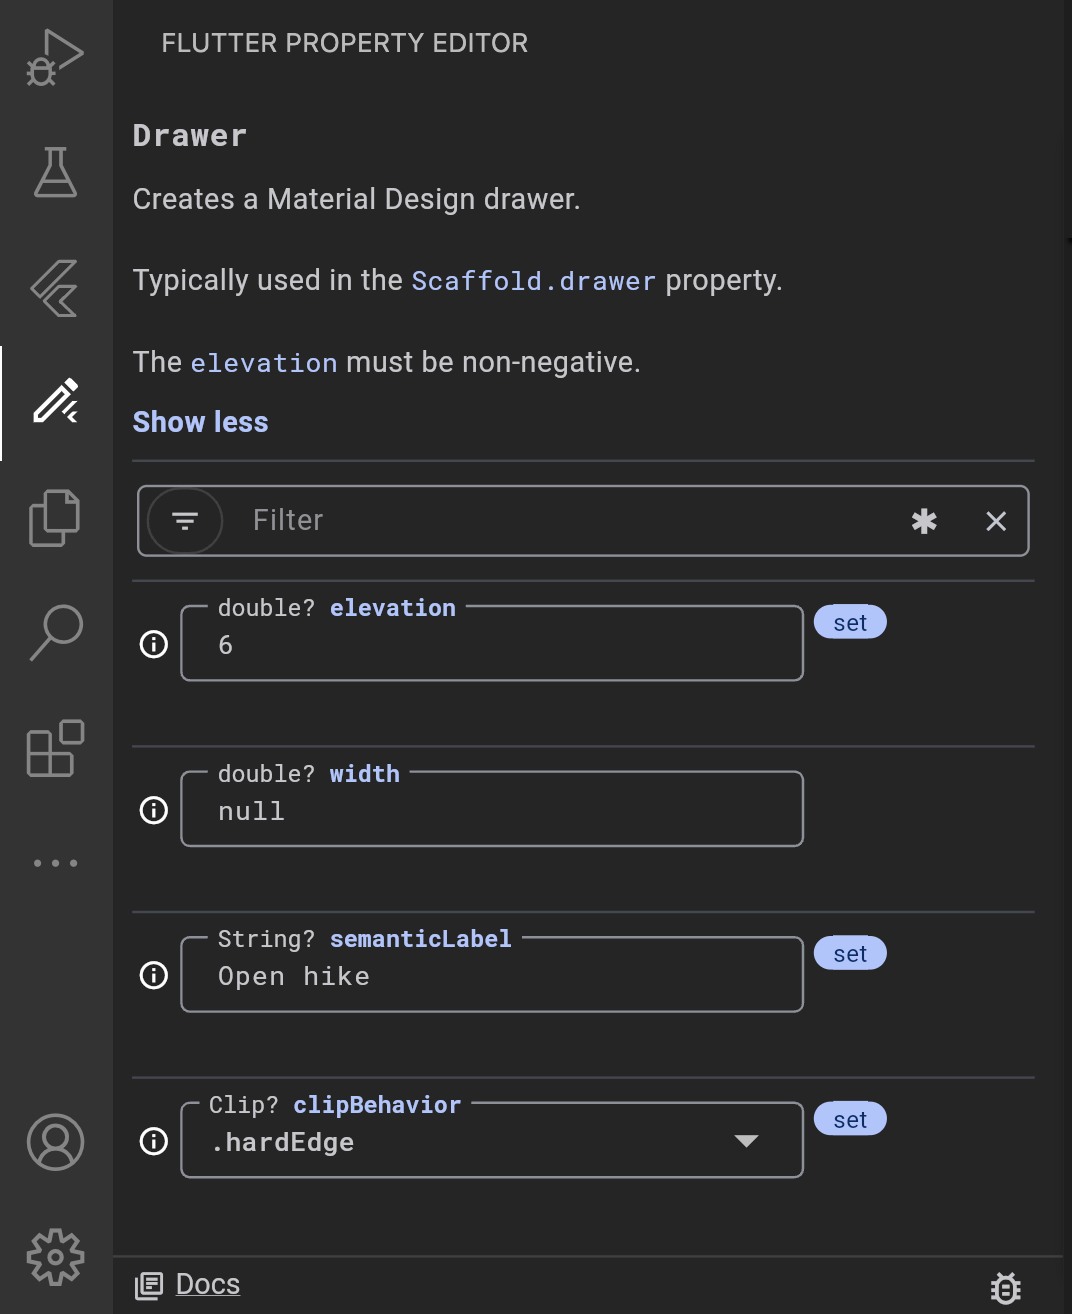
The Flutter Property Editor is a powerful tool provided by the [Flutter
extension][] that lets you view and modify widget properties directly from its
visual interface.
Flutter Property Editor 是 [Flutter 扩展][Flutter extension] 提供的一个强大工具,
让你直接从可视化界面查看和修改 widget 属性。
### How to open the Flutter Property Editor in VS Code
### 如何在 VS Code 中打开 Flutter Property Editor
1. Click on the Flutter Property Editor **icon** {:width="20px"} in the VS Code sidebar.
点击 VS Code 侧边栏中的 Flutter Property Editor **图标** {:width="20px"}。
2. The Flutter Property Editor will load in the side panel.
Flutter Property Editor 会在侧边面板中加载。
3. Please refer to the Flutter Property Editor [documentation][] for a detailed usage guide.
有关详细的使用指南,请参阅 Flutter Property Editor [文档][documentation]。
{:width="600px"}
[Flutter extension]: https://marketplace.visualstudio.com/items?itemName=Dart-Code.flutter
[documentation]: /tools/property-editor
## Troubleshooting
## 故障排除
### Known issues and feedback
### 已知问题和反馈
All known bugs are tracked in the issue tracker:
[Dart and Flutter extensions GitHub issue tracker][issue tracker].
We welcome feedback,
both on bugs/issues and feature requests.
所有已知 bug 在这个 issue 列表中记录:
[Dart 和 Flutter 扩展 GitHub issue 追踪][issue tracker]。
我们非常欢迎 bugs/issues 和特性请求的反馈。
Prior to filing new issues:
在提交新 issue 之前:
- Do a quick search in the issue trackers to see if the
issue is already tracked.
在 issue 列表中查找看该问题是否已被记录。
- Make sure you are [up to date](#updating) with the most recent
version of the plugin.
确保你已经 [更新](#updating) 最新版本插件。
When filing new issues, include [flutter doctor][] output.
提交新 issue 时,请包含 [flutter doctor][] 输出。
[Command Palette]: https://code.visualstudio.com/docs/getstarted/userinterface#_command-palette
[DevTools]: /tools/devtools
[flutter doctor]: /resources/bug-reports/#provide-some-flutter-diagnostics
[Flutter inspector]: /tools/devtools/inspector
[Flutter's build modes]: /testing/build-modes
[Hot reload]: /tools/hot-reload
[let us know]: https://github.com/cfug/flutter.cn/issues/new
[issue tracker]: https://github.com/Dart-Code/Dart-Code/issues
[Running DevTools from VS Code]: /tools/devtools/vscode
[VS Code status bar]: /assets/images/docs/tools/vs-code/device_status_bar.png