# 使用性能视图 (Performance view)
> 学习如何使用开发者工具的性能视图。
:::note
The DevTools performance view works for Flutter mobile and desktop apps.
For web apps, Flutter adds timeline events to the
performance panel of Chrome DevTools instead.
To learn about profiling web apps,
check out [Debugging web performance][].
性能视图可用于 Flutter 移动端、Flutter 桌面端、Dart 和 Flutter 网页端应用。
Flutter 会在 Chrome DevTools 中添加时间线事件。
若你想了解如何分析 Flutter 网页应用的性能,请参阅
[调试 Web 应用性能][Debugging web performance]。
:::
[Debugging web performance]: /perf/web-performance
The performance page can help you diagnose performance
problems and UI jank in your application.
This page offers timing and performance information
for activity in your application.
It consists of several tools to help you identify
the cause of poor performance in your app:
性能页面可以帮助你诊断应用中的性能问题和 UI 卡顿。
该页面提供了应用中活动的时间和性能信息。
它由几个工具组成,可帮助你识别应用中性能不佳的原因:
* Flutter frames chart (Flutter apps only)
Flutter 帧图表(仅 Flutter 应用)
* Frame analysis tab (Flutter apps only)
帧分析标签页(仅 Flutter 应用)
* Timeline events trace viewer (all native Dart applications)
时间轴事件跟踪查看器(所有原生 Dart 应用)
* Advanced debugging tools (Flutter apps only)
高级调试工具(仅 Flutter 应用)
:::secondary
**Use a [profile build][] of your application to analyze performance.**
Frame rendering times aren't indicative of release performance
when running in debug mode. Run your app in profile mode,
which still preserves useful debugging information.
**使用 [profile build][] 来分析性能。**
帧渲染时间在调试模式下不代表发布模式的性能。
请在 profile 模式下运行应用,它仍然保留了有用的调试信息。
:::
[profile build]: /testing/build-modes#profile
The performance view also supports importing and exporting of
data snapshots. For more information,
check out the [Import and export][] section.
性能视图还支持导入和导出数据快照。
更多信息,请查看 [导入和导出][Import and export] 部分。
## What is a frame in Flutter?
## Flutter 中的帧是什么?
Flutter is designed to render its UI at 60 frames per second
(fps), or 120 fps on devices capable of 120Hz updates.
Each render is called a _frame_.
This means that, approximately every 16ms, the UI updates
to reflect animations or other changes to the UI. A frame
that takes longer than 16ms to render causes jank
(jerky motion) on the display device.
Flutter 的 UI 设计为每秒渲染 60 帧(fps),或者在支持 120Hz 更新的设备上为 120 帧。
每次渲染称为一帧。
这意味着,大约每 16ms,UI 就会更新以反映动画或 UI 的其他更改。
渲染时间超过 16ms 的帧会导致显示设备上的卡顿(抖动)。
## Flutter frames chart
## Flutter 帧图表
This chart contains Flutter frame information for your application.
Each bar set in the chart represents a single Flutter frame.
The bars are color-coded to highlight the different portions
of work that occur when rendering a Flutter frame: work from
the UI thread and work from the raster thread.
此图表包含了应用的帧信息。
图表中每组条形图代表每一帧。
这些条形图以颜色区分渲染帧时进行的不同工作:
UI 线程和光栅线程(以前称为 GPU 线程)。
This chart contains Flutter frame timing information for your
application. Each pair of bars in the chart represents a single
Flutter frame. Selecting a frame from this chart updates the data
that is displayed below in the [Frame analysis](#frame-analysis-tab) tab
or the [Timeline events](#timeline-events-tab) tab.
此图表在时间线上显示应用的帧信息。
图表中每组条形图代表每一帧。
从图表选中一帧,
就会更新下面 [帧分析](#frame-analysis-tab) 标签页
或 [时间线事件](#timeline-events-tab) 标签页中显示的数据。
[DevTools 2.23.1]: /tools/devtools/release-notes/release-notes-2.23.1
The flutter frames chart updates when new frames
are drawn in your app. To pause updates to this chart,
click the pause button to the right of the chart.
This chart can be collapsed to provide more viewing space
for data below by clicking the **Flutter frames** button above the chart.
在应用程序运行过程中绘制新的帧时,会更新 Flutter 帧图表。
点击图表右侧的暂停按钮就可以暂停图表的更新,
点击图表上方的 **Flutter frames** 按钮,
可以将此图表折叠起来,为下面的数据提供更多的观察空间。

The pair of bars representing each Flutter frame are color-coded
to highlight the different portions of work that occur when rendering
a Flutter frame: work from the UI thread and work from the raster thread.
每一组条形图以颜色区分,突出显示渲染每一帧时进行的不同工作:
来自 UI 线程和光栅线程(以前称为 GPU 线程)的工作。
### UI
The UI thread executes Dart code in the Dart VM. This includes
code from your application as well as the Flutter framework.
When your app creates and displays a scene, the UI thread creates
a layer tree, a lightweight object containing device-agnostic
painting commands, and sends the layer tree to the raster thread
to be rendered on the device. Do **not** block this thread.
UI 线程执行 Dart VM 中的 Dart 代码。
它包括你的应用程序和 Flutter 框架的所有代码。
当你创建或打开一个页面,
UI 线程会创建一个图层树和一个轻量级的与设备无关的绘制指令集,
并把图层树交给设备的光栅线程进行渲染。
**不要** 阻塞这个线程。
### Raster
### 光栅线程 (Raster)
The raster thread executes graphics code from the Flutter Engine.
This thread takes the layer tree and displays it by talking to
the GPU (graphic processing unit). You can't directly access
the raster thread or its data, but if this thread is slow,
it's a result of something you've done in the Dart code.
Skia, the graphics library, runs on this thread.
[Impeller][] also uses this thread.
[Impeller]: /perf/impeller
光栅线程执行 Flutter 引擎中图形相关的代码。
这个线程通过与 GPU (图形处理单元) 通信,获取图形树并显示它。
你不能直接访问光栅线程或它的数据,但如果这个线程较慢,
那它肯定是由你的 Dart 代码引起的。
图形化库 Skia 运行在这个线程上。
[Impeller][] 也将运行在这个线程上。
Sometimes a scene results in a layer tree that is easy to construct,
but expensive to render on the raster thread. In this case, you
need to figure out what your code is doing that is causing
rendering code to be slow. Specific kinds of workloads are more
difficult for the GPU. They might involve unnecessary calls to
`saveLayer()`, intersecting opacities with multiple objects,
and clips or shadows in specific situations.
有时候一个页面的图形层树比较容易构建但光栅线程的渲染却比较昂贵。
在这种情形下,你需要找出导致渲染变慢的代码。
为 GPU 设定特定多种类型的 workload 是相当困难的。
在一些特定的情形下,多个对象的透明度重叠、剪切或阴影,
有可能会导致不必要的 `saveLayer()` 的调用。
For more information on profiling, check out
[Identifying problems in the GPU graph][GPU graph].
更多详细信息,请查看文档 [定位 GPU 图表中的问题][GPU graph]。
### Jank (slow frame)
### 卡顿 (Jank)
The frame rendering chart shows jank with a red overlay.
A frame is considered to be janky if it takes more than
~16 ms to complete (for 60 FPS devices). To achieve a frame rendering rate of
60 FPS (frames per second), each frame must render in
~16 ms or less. When this target is missed, you may
experience UI jank or dropped frames.
帧渲染图表使用红色图层显示帧延时。
如果一帧的渲染时间超过 16ms,则会被认为此帧是延时的,
为了达到帧渲染频率到 60 FPS (每秒帧数),
每一帧的渲染时间必须等于或少于 16 ms。
如果没有达到这个目标,你会发现 UI 不流畅或丢帧。
For more information on how to analyze your app's performance,
check out [Flutter performance profiling][].
更多关于性能分析信息,请查看文档:[Flutter 性能分析][Flutter performance profiling]。
### Shader compilation
### 着色器渲染
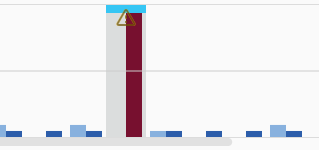
Shader compilation occurs when a shader is first used in your Flutter
app. Frames that perform shader compilation are marked in dark
red:
在 Flutter 应用中,着色器会在初次使用时发生渲染。参与了着色器编译的构建帧已标记为深红色:
For more information on how to reduce shader compilation jank,
check out [Reduce shader compilation jank on mobile][].
想要了解更多关于如何减少着色器缓存卡顿的内容,阅读
[在移动端减少着色器编译卡顿][Reduce shader compilation jank on mobile]。
## Frame analysis tab
## 帧分析标签页
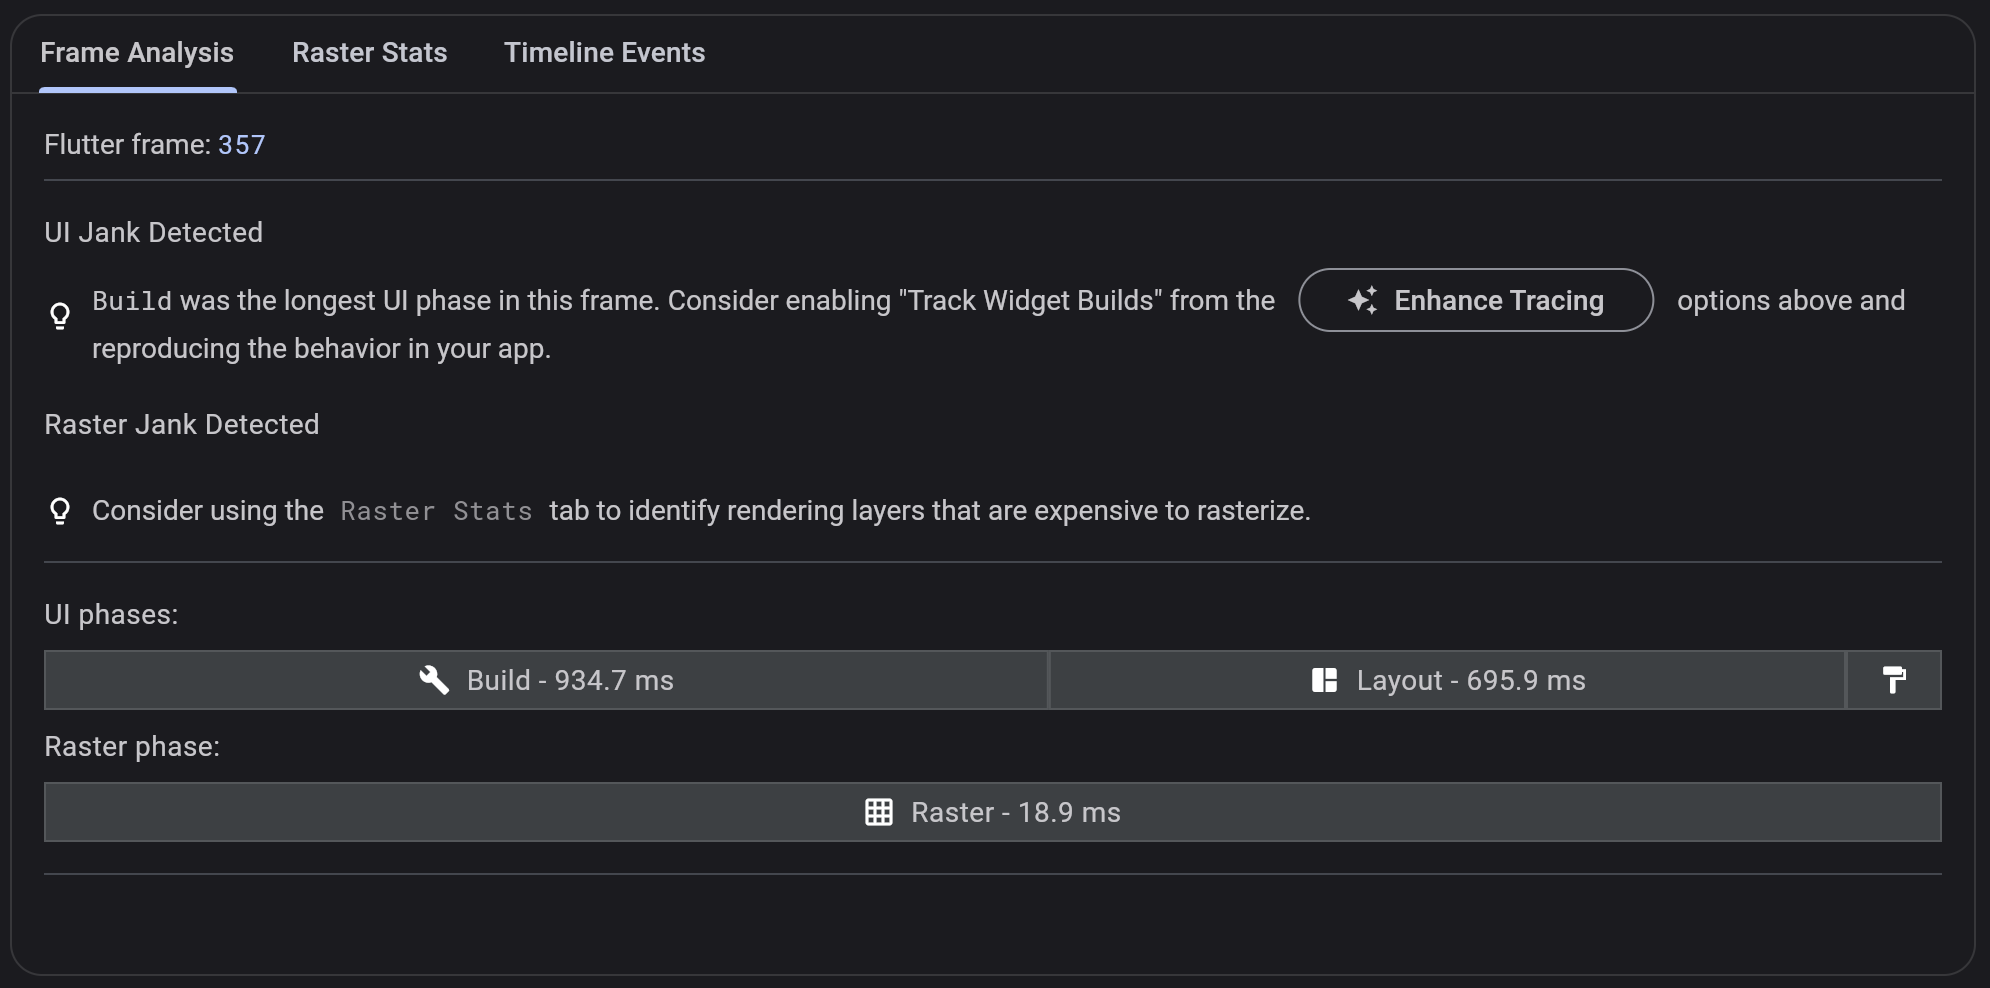
Selecting a janky frame (slow, colored in red)
from the Flutter frames chart above shows debugging hints
in the Frame analysis tab. These hints help you diagnose
jank in your app, and notify you of any expensive operations
that we have detected that might have contributed to the slow frame time.
从上面的 Flutter 帧图表中选择一个延时的帧(红色),
会在帧分析标签页中显示调试提示。
这些提示可以帮助你诊断应用中的卡顿,
并通知你任何昂贵的操作,我们检测到这些操作可能会导致帧延时。
## Timeline events tab
## 时间线事件表
The timeline events chart shows all event tracing from your application.
The Flutter framework emits timeline events as it works to build frames,
draw scenes, and track other activity such as HTTP request timings
and garbage collection. These events show up here in the Timeline.
You can also send your own Timeline events using the dart:developer
[`Timeline`][] and [`TimelineTask`][] APIs.
时间线事件图表显示了应用程序的所有事件追踪。
Flutter 底层框架在构建帧、绘制场景和
跟踪其他活动(如 HTTP 请求时间和垃圾回收)时,会发出时间线事件。
这些事件会在时间线中显示出来。
你也可以使用 dart:developer [`Timeline`][] 和 [`TimelineTask`][] API 发送
你自己的时间线事件。
[`Timeline`]: https://api.flutter-io.cn/flutter/dart-developer/Timeline-class.html
[`TimelineTask`]: https://api.flutter-io.cn/flutter/dart-developer/TimelineTask-class.html

For help with navigating and using the trace viewer,
click the **?** button at the top right of the timeline
events tab bar. To refresh the timeline with new events from
your application, click the refresh button
(also in the upper right corner of the tab controls).
关于导航和使用跟踪查看器的帮助,
请点击时间线事件标签栏右上方的 **?** 按钮。
要使用应用程序中的新事件,请单击刷新按钮(也位于选项卡的右上角)。
## Advanced debugging tools
## 高级调试工具
### Enhance tracing
### 增强的追踪选项
To view more detailed tracing in the timeline events chart,
use the options in the enhance tracing dropdown:
想要在时间线事件图表里查看更详细的追踪内容,请使用增强的追踪下拉控件里的选项:
:::note
Frame times might be negatively affected when these options are enabled.
启用该选项后,帧构建时间可能会受到影响。
:::

To see the new timeline events, reproduce the activity
in your app that you are interested in tracing,
and then select a frame to inspect the timeline.
你可以重复操作你想要追踪的行为来查看新的时间线事件,
操作后可以在时间线中选择一个构建帧进行查看。
### Track widget builds
### 追踪 widget 的构建
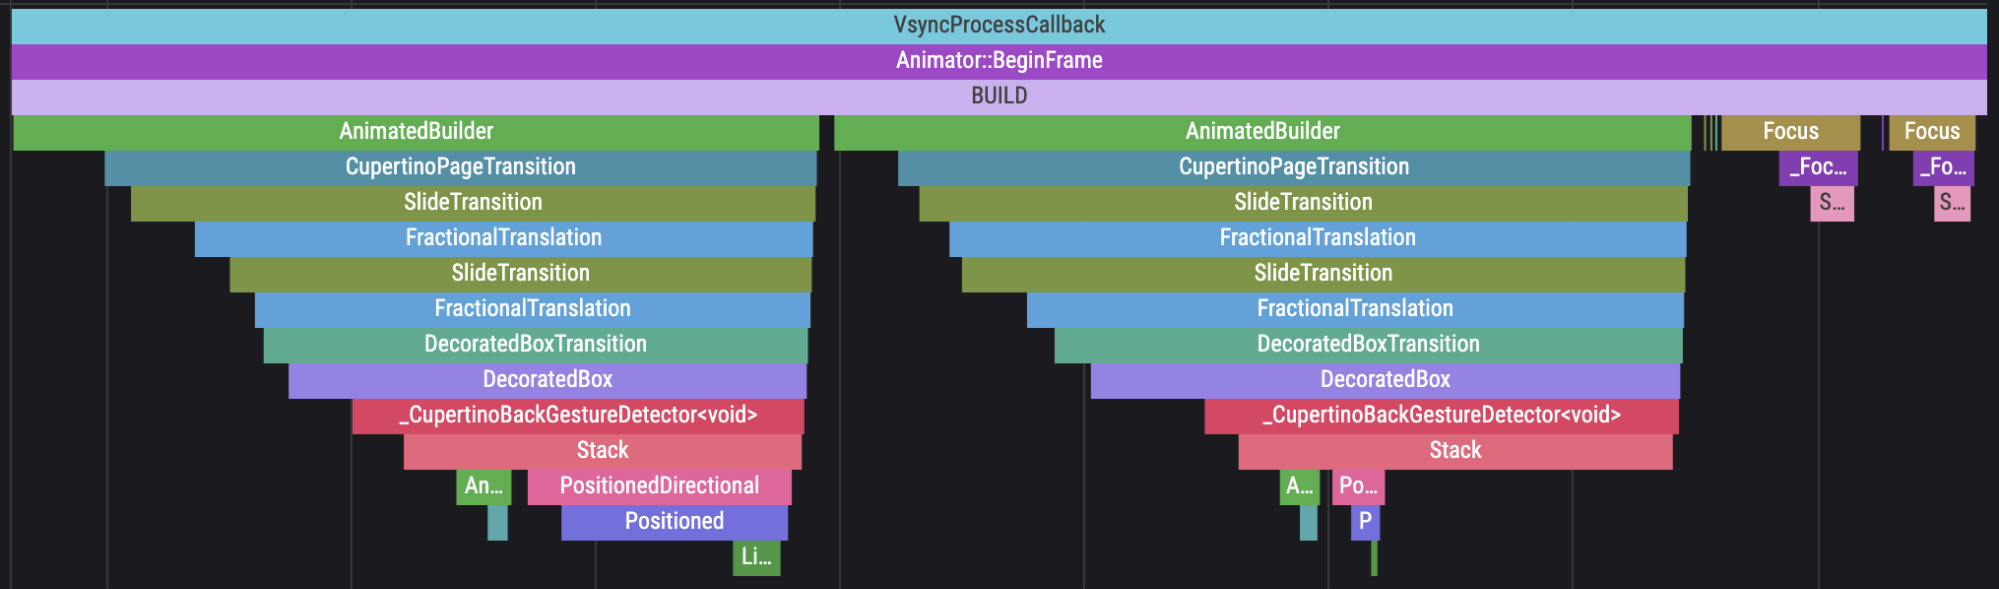
To see the `build()` method events in the timeline,
enable the **Track Widget Builds** option.
The name of the widget is shown in the timeline event.
想要在时间线中查看 `build()` 方法的事件,启用 **Track Widget Builds** 选项,
时间线中将出现 widget 对应名称的事件。
[Watch this video for an example of tracking widget builds][track-widgets]
[观看追踪 widget 构建的示例视频][track-widgets]
### Track layouts
### 追踪布局
To see render object layout events in the timeline,
enable the **Track Layouts** option:
想要在时间线中查看 `RenderObject` 布局构建的事件,启用 **Track Layouts** 选项:

[Watch this video for an example of tracking layouts][track-layouts]
[观看追踪布局的示例视频][track-layouts]
### Track paints
### 追踪绘制
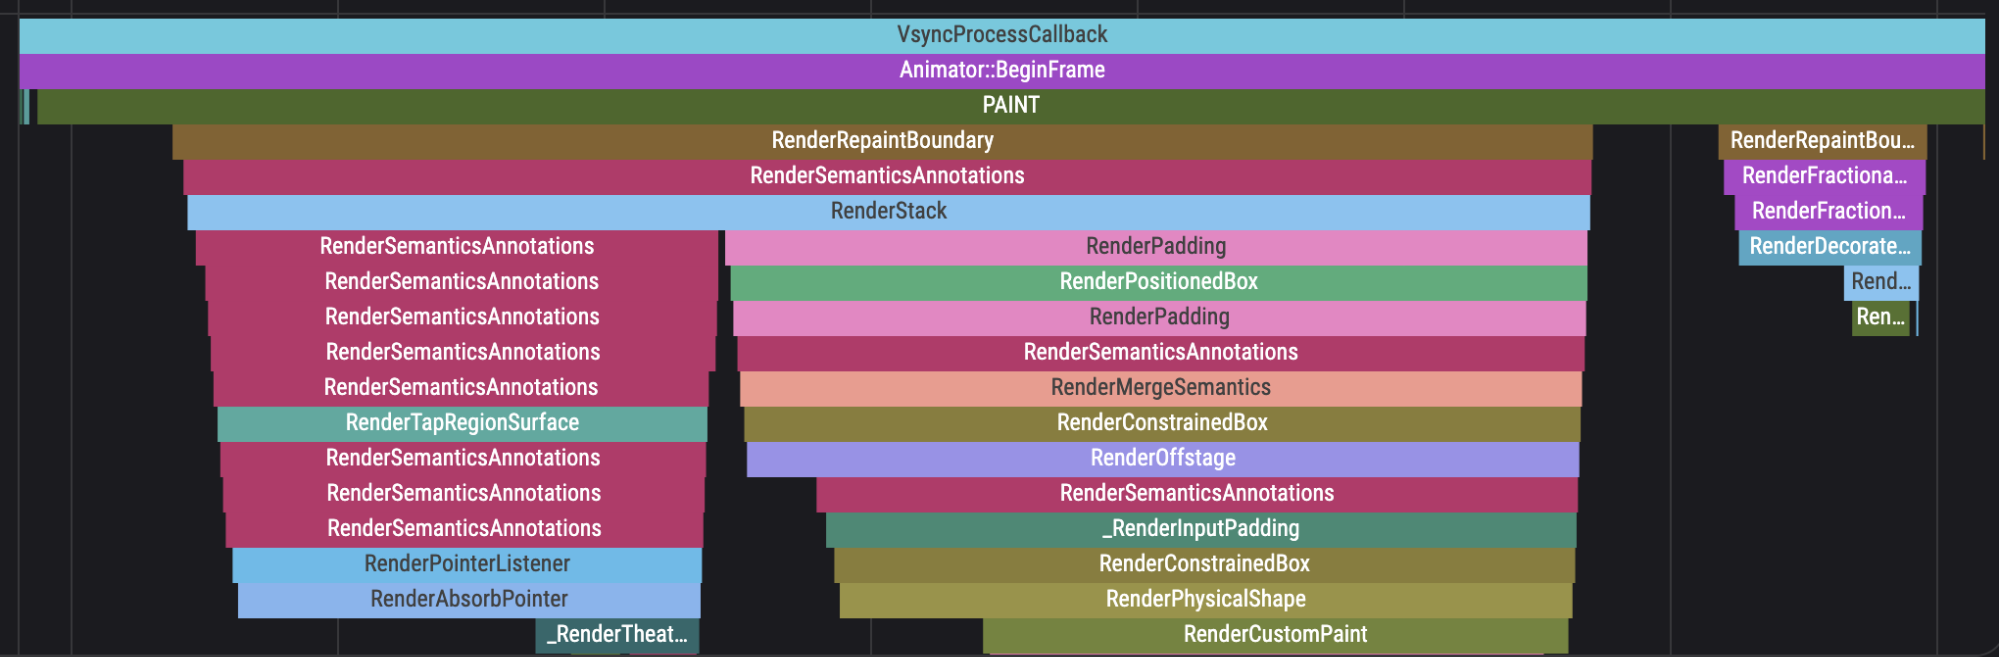
To see render object paint events in the timeline,
enable the **Track Paints** option:
想要在时间线中查看 `RenderObject` 的绘制事件,
启用 **Track Paints** 选项:
[Watch this video for an example of tracking paints][track-paints]
[观看追踪绘制的示例视频][track-paints]
## More debugging options
## 更多调试选项
To diagnose performance problems related to rendering layers,
toggle off a rendering layer.
These options are enabled by default.
想要诊断渲染图层相关的问题,请先关闭渲染层。
下述的选项将会默认启动。
To see the effects on your app's performance,
reproduce the activity in your app.
Then select the new frames in the frames chart
to inspect the timeline events
with the layers disabled.
If raster time has significantly decreased,
excessive use of the effects you disabled might be contributing
to the jank you saw in your app.
想要查看你的应用的性能影响,请尝试以相同的操作重现性能问题。
在渲染层关闭的情况下,于构建帧图表里选择一个新的构建帧,
查看它的时间线细节。
如果光栅线程的时间消耗有显著降低,
那么你禁用的效果的滥用可能是导致卡顿的主要原因。
**Render Clip layers**
Disable this option to check whether excessive use of clipping
is affecting performance.
If performance improves with this option disabled,
try to reduce the use of clipping effects in your app.
**渲染裁剪的图层**
禁用该选项来检查已使用的裁剪图层是否影响了性能。
如果禁用后性能有显著提升,请尝试减少你的应用中裁剪效果的使用。
**Render Opacity layers**
Disable this option to check whether
excessive use of opacity effects are affecting performance.
If performance improves with this option disabled,
try to reduce the use of opacity effects in your app.
**渲染透明度图层**
禁用该选项来检查已使用的透明度图层是否影响了性能。
如果禁用后性能有显著提升,请尝试减少你的应用中透明度效果的使用。
**Render Physical Shape layers**
Disable this option to check whether excessive
use of physical modeling effects are affecting performance,
such as shadows or elevation.
If performance improves with this option disabled,
try to reduce the use of physical modeling effects in your app.
**渲染物理形状图层**
禁用该选项来检查已使用的物理形状图层是否影响了性能,例如阴影和背景特效。
如果禁用后性能有显著提升,请尝试减少你的应用中物理效果的使用。

## Import and export
## 导入导出
DevTools supports importing and exporting performance snapshots.
Clicking the export button (upper-right corner above the
frame rendering chart) downloads a snapshot of the current data on the
performance page. To import a performance snapshot, you can drag and drop the
snapshot into DevTools from any page. **Note that DevTools only
supports importing files that were originally exported from DevTools.**
DevTools 支持导入和导出时间线快照。单击 export 按钮
(帧渲染图表右上角) 下载当前时间线的快照。
要导入时间线快照,可以从任何页面拖放快照到 DevTools。
提示:DevTools 仅支持导入 DevTools 导出的源文件。
## Other resources
## 其他资源
To learn how to monitor an app's performance and
detect jank using DevTools, check out a guided
[Performance View tutorial][performance-tutorial].
想要学习如何使用 DevTools 监控应用的性能和检测卡顿,
可以阅读 [性能视图教程][performance-tutorial]。
[GPU graph]: /perf/ui-performance#identifying-problems-in-the-gpu-graph
[Flutter performance profiling]: /perf/ui-performance
[Reduce shader compilation jank on mobile]: /perf/rendering-performance
[Import and export]: #import-and-export
[performance-tutorial]: https://medium.com/@fluttergems/mastering-dart-flutter-devtools-performance-view-part-8-of-8-4ae762f91230
[track-widgets]: https://www.youtube.com/watch/_EYk-E29edo?t=623
[track-layouts]: https://www.youtube.com/watch/_EYk-E29edo?t=676
[track-paints]: https://www.youtube.com/watch/_EYk-E29edo?t=748