# 使用内存视图 (Memory view)
> 学习如何使用开发者工具的内存视图。
The memory view provides insights into details
of the application's memory allocation and
tools to detect and debug specific issues.
内存视图深入呈现了应用内存分配的细节,
并提供了用于检测和调试特定问题的工具。
:::note
This page is up to date for DevTools 2.23.0.
本页面内容已针对 DevTools 2.23.0 更新。
:::
For information on how to locate DevTools screens in different IDEs,
check out the [DevTools overview](/tools/devtools).
想要了解如何在不同的 IDE 中找到开发者工具的界面,
请查阅 [开发者工具概览](/tools/devtools)。
To better understand the insights found on this page,
the first section explains how Dart manages memory.
If you already understand Dart's memory management,
you can skip to the [Memory view guide](#memory-view-guide).
为了更好地理解本页面所呈现的内容,
第一节将介绍 Dart 是如何管理内存的。
如果你已经了解 Dart 的内存管理机制,
可以直接跳转到 [内存视图指南](#memory-view-guide)。
## Reasons to use the memory view
## 使用内存视图的场景
Use the memory view for preemptive memory optimization or when
your application experiences one of the following conditions:
当你想要对内存进行预防性优化,或者你的应用遇到以下情况之一时,
可以使用内存视图:
* Crashes when it runs out of memory
内存耗尽导致崩溃
* Slows down
运行变慢
* Causes the device to slow down or become unresponsive
导致设备变慢或无响应
* Shuts down because it exceeded the memory limit, enforced by operating system
因超出操作系统设定的内存上限而被关闭
* Exceeds memory usage limit
超出内存使用上限
* This limit can vary depending on the type of devices your app targets.
这个上限会因应用所面向的设备类型不同而有所差异。
* Suspect a memory leak
怀疑存在内存泄漏
## Basic memory concepts
## 基本内存概念
Dart objects created using a class constructor
(for example, by using `MyClass()`) live in a
portion of memory called the _heap_. The memory
in the heap is managed by the Dart VM (virtual machine).
The Dart VM allocates memory for the object at the moment of the object creation,
and releases (or deallocates) the memory when the object
is no longer used (see [Dart garbage collection][]).
通过类的构造函数创建的 Dart 对象
(例如使用 `MyClass()`)存放在一块称为 **堆** (heap) 的内存区域中。
堆中的内存由 Dart VM(虚拟机)管理。
Dart VM 在对象创建的时刻为其分配内存,
并在该对象不再被使用时释放(或回收)这块内存
(请参阅 [Dart 垃圾回收][Dart garbage collection])。
[Dart garbage collection]: https://flutter.dev/blog/flutter-dont-fear-the-garbage-collector
### Object types
### 对象类型
#### Disposable object
#### Disposable object(可释放对象)
A disposable object is any Dart object that defines a `dispose()` method.
To avoid memory leaks, invoke `dispose` when the object isn't needed anymore.
可释放对象是指任何定义了 `dispose()` 方法的 Dart 对象。
为了避免内存泄漏,当不再需要该对象时,请调用 `dispose`。
#### Memory-risky object
#### Memory-risky object(内存风险对象)
A memory-risky object is an object that _might_ cause a memory leak,
if it is not disposed properly or disposed but not GCed.
内存风险对象是指那些 **可能** 导致内存泄漏的对象,
比如没有被正确释放,或者已经释放却没有被 GC 回收。
### Root object, retaining path, and reachability
### 根对象、保留路径与可达性
#### Root object
#### Root object(根对象)
Every Dart application creates a _root object_ that references,
directly or indirectly, all other objects the application allocates.
每个 Dart 应用都会创建一个 **根对象** (root object),
它会直接或间接地引用应用所分配的所有其他对象。
#### Reachability
#### Reachability(可达性)
If, at some moment of the application run,
the root object stops referencing an allocated object,
the object becomes _unreachable_,
which is a signal for the garbage collector (GC)
to deallocate the object's memory.
如果在应用运行的某个时刻,
根对象不再引用某个已分配的对象,
那么这个对象就变为 **不可达** (unreachable) 状态,
这就是一个信号,告诉垃圾回收器 (GC)
可以回收该对象的内存了。
#### Retaining path
#### Retaining path(保留路径)
The sequence of references from root to an object
is called the object's _retaining_ path,
as it retains the object's memory from the garbage collection.
One object can have many retaining paths.
Objects with at least one retaining path are
called _reachable_ objects.
从根对象到某个对象的引用序列称为该对象的**保留** (retaining) 路径,
因为它使该对象的内存不被垃圾回收。
一个对象可以拥有多条保留路径。
拥有至少一条保留路径的对象称为**可达** (reachable) 对象。
#### Example
#### 示例
The following example illustrates the concepts:
下面的示例阐明了这些概念:
```dart
class Child{}
class Parent {
Child? child;
}
Parent parent1 = Parent();
void myFunction() {
Child? child = Child();
// The `child` object was allocated in memory.
// It's now retained from garbage collection
// by one retaining path (root …-> myFunction -> child).
Parent? parent2 = Parent()..child = child;
parent1.child = child;
// At this point the `child` object has three retaining paths:
// root …-> myFunction -> child
// root …-> myFunction -> parent2 -> child
// root -> parent1 -> child
child = null;
parent1.child = null;
parent2 = null;
// At this point, the `child` instance is unreachable
// and will eventually be garbage collected.
…
}
```
### Shallow size vs retained size
### 浅层大小与保留大小
**Shallow size** includes only the size of the object
and its references, while **retained size** also includes
the size of the retained objects.
**浅层大小** (shallow size) 只包含对象本身及其引用所占的大小,
而**保留大小** (retained size) 还包含被该对象保留的那些对象的大小。
The **retained size** of the root object includes
all reachable Dart objects.
根对象的 **保留大小** 包含所有可达的 Dart 对象。
In the following example, the size of `myHugeInstance`
isn't part of the parent's or child's shallow sizes,
but is part of their retained sizes:
在下面的示例中,`myHugeInstance` 的大小
不计入 parent 或 child 的浅层大小,
但计入它们各自的保留大小:
```dart
class Child{
/// The instance is part of both [parent] and [parent.child]
/// retained sizes.
final myHugeInstance = MyHugeInstance();
}
class Parent {
Child? child;
}
Parent parent = Parent()..child = Child();
```
In DevTools calculations, if an object has more
than one retaining path, its size is assigned as
retained only to the members of the shortest retaining path.
在开发者工具的计算中,如果某个对象拥有多条保留路径,
它的大小只会被计入最短保留路径上的成员的保留大小。
In this example the object `x` has two retaining paths:
在这个示例中,对象 `x` 拥有两条保留路径:
```console
root -> a -> b -> c -> x
root -> d -> e -> x (shortest retaining path to `x`)
```
Only members of the shortest path (`d` and `e`) will include
`x` into their retaining size.
只有最短路径上的成员(`d` 和 `e`)会把
`x` 计入它们的保留大小。
### Memory leaks happen in Dart?
### Dart 中也会发生内存泄漏吗?
Garbage collector cannot prevent all types of memory leaks, and developers
still need to watch objects to have leak-free lifecycle.
垃圾回收器无法防止所有类型的内存泄漏,开发者
仍然需要关注对象,以确保其生命周期不发生泄漏。
#### Why can't the garbage collector prevent all leaks?
#### 为什么垃圾回收器无法防止所有泄漏?
While the garbage collector takes care of all
unreachable objects, it's the responsibility
of the application to ensure that unneeded objects
are no longer reachable (referenced from the root).
虽然垃圾回收器会处理所有不可达的对象,
但确保不再需要的对象变为不可达
(即不再被根对象引用)是应用自身的责任。
So, if non-needed objects are left referenced
(in a global or static variable,
or as a field of a long-living object),
the garbage collector can't recognize them,
the memory allocation grows progressively,
and the app eventually crashes with an `out-of-memory` error.
因此,如果不再需要的对象仍被引用
(保存在全局变量或静态变量中,
或者作为某个长生命周期对象的字段),
垃圾回收器就无法识别它们,
内存分配会逐步增长,
应用最终会因 `out-of-memory`(内存不足)错误而崩溃。
#### Why closures require extra attention
#### 为什么闭包需要格外注意
One hard-to-catch leak pattern relates to using closures.
In the following code, a reference to the
designed-to-be short-living `myHugeObject` is implicitly
stored in the closure context and passed to `setHandler`.
As a result, `myHugeObject` won't be garbage collected
as long as `handler` is reachable.
有一种难以察觉的泄漏模式与闭包的使用有关。
在下面的代码中,本应是短生命周期的 `myHugeObject` 的引用
被隐式地保存在闭包的上下文中,并传递给了 `setHandler`。
因此,只要 `handler` 仍然可达,
`myHugeObject` 就不会被垃圾回收。
```dart
final handler = () => print(myHugeObject.name);
setHandler(handler);
```
#### Why `BuildContext` requires extra attention
#### 为什么 `BuildContext` 需要格外注意
An example of a large, short-living object that
might squeeze into a long-living area and thus cause leaks,
is the `context` parameter passed to Flutter's
`build` method.
一个体积大、生命周期短,却可能挤进长生命周期区域从而导致泄漏的对象,
就是传递给 Flutter `build` 方法的 `context` 参数。
The following code is leak prone,
as `useHandler` might store the handler
in a long-living area:
下面的代码容易引发泄漏,
因为 `useHandler` 可能会把 handler
保存在某个长生命周期的区域中:
```dart
// BAD: DO NOT DO THIS
// This code is leak prone:
@override
Widget build(BuildContext context) {
final handler = () => apply(Theme.of(context));
useHandler(handler);
…
```
#### How to fix leak prone code?
#### 如何修复容易泄漏的代码?
The following code is not leak prone,
because:
下面的代码不会引发泄漏,
原因如下:
1. The closure doesn't use the large and short-living `context` object.
闭包没有使用体积大、生命周期短的 `context` 对象。
2. The `theme` object (used instead) is long-living. It is created once and
shared between `BuildContext` instances.
作为替代使用的 `theme` 对象是长生命周期的。它只会被创建一次,
并在多个 `BuildContext` 实例之间共享。
```dart
// GOOD
@override
Widget build(BuildContext context) {
final theme = Theme.of(context);
final handler = () => apply(theme);
useHandler(handler);
…
```
#### General rule for `BuildContext`
#### `BuildContext` 的通用规则
In general, use the following rule for a
`BuildContext`: if the closure doesn't outlive
the widget, it's ok to pass the context to the closure.
一般来说,可以为 `BuildContext` 套用这样一条规则:
如果闭包的生命周期不超过 widget,
那么把 context 传递给该闭包是安全的。
Stateful widgets require extra attention.
They consist of two classes: the [widget and the
widget state][interactive],
where the widget is short living,
and the state is long living. The build context,
owned by the widget, should never be referenced
from the state's fields, as the state won't be garbage
collected together with the widget, and can significantly outlive it.
有状态 (Stateful) widget 需要格外注意。
它们由两个类组成:[widget 和 widget state][interactive],
其中 widget 是短生命周期的,
而 state 是长生命周期的。由 widget 持有的 build context,
绝不应该被 state 的字段所引用,
因为 state 不会随 widget 一起被垃圾回收,并且可能比 widget 存活得久得多。
[interactive]: /ui/interactivity#creating-a-stateful-widget
### Memory leak vs memory bloat
### 内存泄漏与内存膨胀
In a memory leak, an application progressively uses memory,
for example, by repeatedly creating a listener,
but not disposing it.
发生内存泄漏时,应用会逐步占用越来越多的内存,
例如反复创建监听器 (listener),
却不释放它。
Memory bloat uses more memory than is necessary for
optimal performance, for example, by using overly large
images or keeping streams open through their lifetime.
内存膨胀则是指使用了超出最优性能所需的内存,
例如使用过大的图片,
或者让数据流 (stream) 在整个生命周期内始终保持打开状态。
Both leaks and bloats, when large,
cause an application to crash with an `out-of-memory` error.
However, leaks are more likely to cause memory issues,
because even a small leak,
if repeated many times, leads to a crash.
无论是内存泄漏还是内存膨胀,当规模较大时,
都会导致应用因 `out-of-memory`(内存不足)错误而崩溃。
不过,泄漏更容易引发内存问题,
因为即使是很小的泄漏,
只要重复足够多次,也会导致崩溃。
## Memory view guide
## 内存视图指南
The DevTools memory view helps you investigate
memory allocations (both in the heap and external),
memory leaks, memory bloat, and more. The view
has the following features:
开发者工具的内存视图可以帮助你排查内存分配
(包括堆内和外部内存)、内存泄漏、内存膨胀等问题。
该视图具有以下功能:
[**Expandable chart**](#expandable-chart)
Get a high-level trace of memory allocation,
and view both standard events (like garbage collection)
and custom events (like image allocation).
[**可展开图表**](#expandable-chart)
获取内存分配的宏观追踪,
既可以查看标准事件(例如垃圾回收),
也可以查看自定义事件(例如图片分配)。
[**Profile Memory** tab](#profile-memory-tab)
See current memory allocation listed by class and
memory type.
[**Profile Memory**(内存分析)标签页](#profile-memory-tab)
按类和内存类型查看当前的内存分配情况。
[**Diff Snapshots** tab](#diff-snapshots-tab)
Detect and investigate a feature's memory management issues.
[**Diff Snapshots**(快照对比)标签页](#diff-snapshots-tab)
检测并排查某个功能的内存管理问题。
[**Trace Instances** tab](#trace-instances-tab)
Investigate a feature's memory management for
a specified set of classes.
[**Trace Instances**(实例追踪)标签页](#trace-instances-tab)
针对一组指定的类,排查某个功能的内存管理情况。
### Expandable chart
### Expandable chart(可展开图表)
The expandable chart provides the following features:
可展开图表提供了以下功能:
#### Memory anatomy
#### Memory anatomy(内存剖析)
A timeseries graph visualizes the state of
Flutter memory at successive intervals of time.
Each data point on the chart corresponds to the
timestamp (x-axis) of measured quantities (y-axis)
of the heap. For example, usage, capacity, external,
garbage collection, and resident set size are captured.
一张时间序列图以连续的时间间隔可视化呈现了
Flutter 内存的状态。
图表上的每个数据点都对应着堆的某次测量值(y 轴)
在某个时间戳(x 轴)上的状态。
例如,使用量、容量、外部内存、
垃圾回收以及常驻集大小都会被记录下来。
{:width="100%"}
内存剖析页面的截图
#### Memory overview chart
#### Memory overview chart(内存概览图表)
The memory overview chart is a timeseries graph
of collected memory statistics. It visually presents
the state of the Dart or Flutter heap and Dart's
or Flutter's native memory over time.
内存概览图表是一张由收集到的内存统计数据绘制而成的时间序列图。
它以可视化的方式呈现了 Dart 或 Flutter 堆,
以及 Dart 或 Flutter 原生内存随时间变化的状态。
The chart's x-axis is a timeline of events (timeseries).
The data plotted in the y-axis all has a timestamp of
when the data was collected. In other words,
it shows the polled state (capacity, used, external,
RSS (resident set size), and GC (garbage collection))
of the memory every 500 ms. This helps provide a live
appearance on the state of the memory as the application is running.
图表的 x 轴是事件的时间线(时间序列)。
绘制在 y 轴上的数据都带有一个数据采集时刻的时间戳。
换句话说,它每隔 500 毫秒展示一次内存的轮询状态
(容量、已用、外部内存、RSS(常驻集大小)以及 GC(垃圾回收))。
这有助于在应用运行时实时呈现内存的状态。
Clicking the **Legend** button displays the
collected measurements, symbols, and colors
used to display the data.
点击 **Legend**(图例)按钮,
即可显示用于展示数据的各项测量指标、符号和颜色。
{:width="100%"}
内存剖析页面的截图
The **Memory Size Scale** y-axis automatically
adjusts to the range of data collected in the
current visible chart range.
**Memory Size Scale**(内存大小刻度)y 轴会根据当前可见图表范围内
所采集数据的取值范围自动进行调整。
The quantities plotted on the y-axis are as follows:
绘制在 y 轴上的各项数值如下:
**Dart/Flutter Heap**
Objects (Dart and Flutter objects) in the heap.
**Dart/Flutter Heap**(Dart/Flutter 堆)
堆中的对象(Dart 和 Flutter 对象)。
**Dart/Flutter Native**
Memory that isn't in the Dart/Flutter heap
but is still part of the total memory footprint.
Objects in this memory would be native objects
(for example, from reading a file into memory,
or a decoded image). The native objects are exposed
to the Dart VM from the native OS (such as Android,
Linux, Windows, iOS) using a Dart embedder.
The embedder creates a Dart wrapper with a finalizer,
allowing Dart code to communicate with these native resources.
Flutter has an embedder for Android and iOS.
For more information, see [Command-line and server apps][],
[Dart on the server with Dart Frog][frog],
[Custom Flutter Engine Embedders][],
[Dart web server deployment with Heroku][heroku].
**Dart/Flutter Native**(Dart/Flutter 原生内存)
不属于 Dart/Flutter 堆,
但仍是总内存占用一部分的内存。
这块内存中的对象属于原生对象
(例如,把文件读入内存时产生的对象,
或者一张解码后的图片)。这些原生对象通过 Dart 嵌入器 (embedder)
从原生操作系统(例如 Android、Linux、Windows、iOS)
暴露给 Dart VM。
嵌入器会创建一个带有终结器 (finalizer) 的 Dart 包装对象,
从而让 Dart 代码能够与这些原生资源进行交互。
Flutter 为 Android 和 iOS 提供了嵌入器。
想要了解更多信息,请参阅 [命令行和服务器应用][Command-line and server apps]、
[使用 Dart Frog 在服务器上运行 Dart][frog]、
[自定义 Flutter 引擎嵌入器][Custom Flutter Engine Embedders]、
[使用 Heroku 部署 Dart Web 服务器][heroku]。
**Timeline**
The timestamps of all collected memory statistics
and events at a particular point in time (timestamp).
**Timeline**(时间线)
在某个特定时间点(时间戳)上,
所有已采集的内存统计数据和事件的时间戳。
**Raster Cache**
The size of the Flutter engine's raster cache
layer(s) or picture(s), while performing the
final rendering after compositing.
For more information, see the
[Flutter architectural overview][]
and [DevTools Performance view][].
**Raster Cache**(光栅缓存)
Flutter 引擎在合成后进行最终渲染时,
光栅缓存图层或图片的大小。
想要了解更多信息,请参阅
[Flutter 架构概览][Flutter architectural overview]
和 [开发者工具性能视图][DevTools Performance view]。
**Allocated**
The current total capacity of all Dart heaps. This is typically
slightly larger than the total size of all heap objects.
**Allocated**(已分配)
当前所有 Dart 堆的总容量。这个值通常
会略大于所有堆对象的总大小。
**RSS - Resident Set Size**
The resident set size displays the amount of memory
for a process.
It doesn't include memory that is swapped out.
It includes memory from shared libraries that are
loaded, as well as all stack and heap memory.
For more information, see [Dart VM internals][].
**RSS - Resident Set Size**(常驻集大小)
常驻集大小显示的是一个进程所占用的内存量。
它不包含已被换出 (swapped out) 的内存。
它包含已加载的共享库所占的内存,
以及全部的栈内存和堆内存。
想要了解更多信息,请参阅 [Dart VM 内部原理][Dart VM internals]。
[Command-line and server apps]: https://dart.cn/server
[Custom Flutter engine embedders]: https://github.com/flutter/flutter/blob/main/docs/engine/Custom-Flutter-Engine-Embedders.md
[Dart VM internals]: https://mrale.ph/dartvm/
[DevTools Performance view]: /tools/devtools/performance
[Flutter architectural overview]: /resources/architectural-overview
[frog]: https://dartfrog.vgv.dev/
[heroku]: https://www.youtube.com/watch?v=nkTUMVNelXA
### Profile Memory tab
### Profile Memory(内存分析)标签页
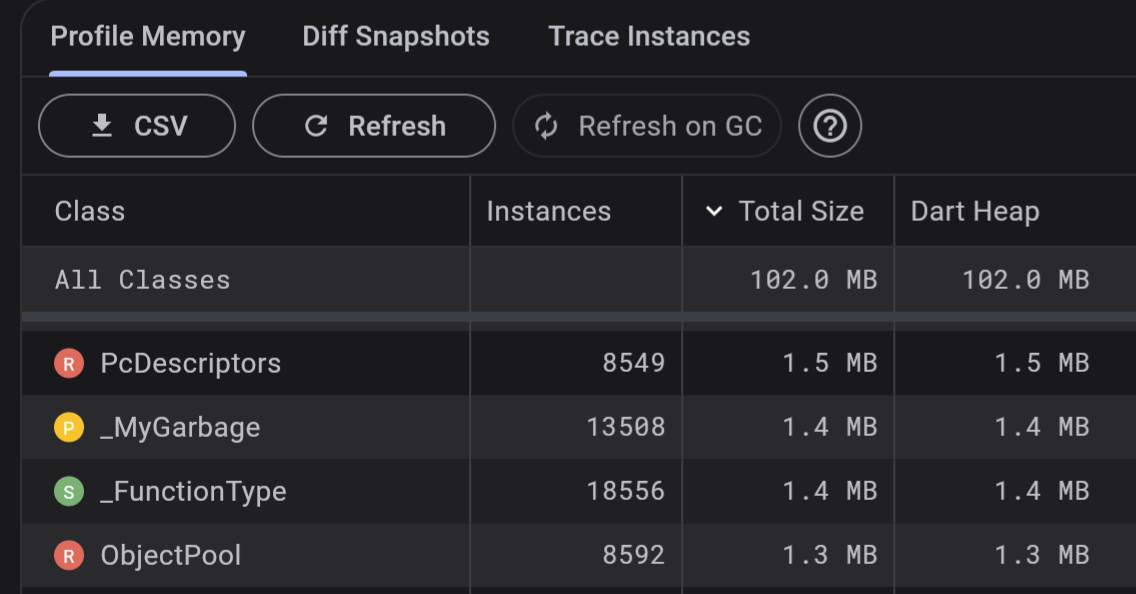
Use the **Profile Memory** tab to see current memory
allocation by class and memory type. For a
deeper analysis in Google Sheets or other tools,
download the data in CSV format.
Toggle **Refresh on GC**, to see allocation in real time.
使用 **Profile Memory**(内存分析)标签页,
可以按类和内存类型查看当前的内存分配情况。
如需在 Google Sheets 或其他工具中进行更深入的分析,
可以下载 CSV 格式的数据。
开启 **Refresh on GC**(GC 时刷新)开关,
即可实时查看内存分配情况。
{:width="100%"}
内存分析标签页的截图
### Diff Snapshots tab
### Diff Snapshots(快照对比)标签页
Use the **Diff Snapshots** tab to investigate a feature's
memory management. Follow the guidance on the tab
to take snapshots before and after interaction
with the application, and diff the snapshots:
使用 **Diff Snapshots**(快照对比)标签页,
可以排查某个功能的内存管理情况。
按照标签页上的指引,
在与应用交互前后分别拍摄快照,
然后对这些快照进行对比:
{:width="100%"}
快照对比标签页的截图
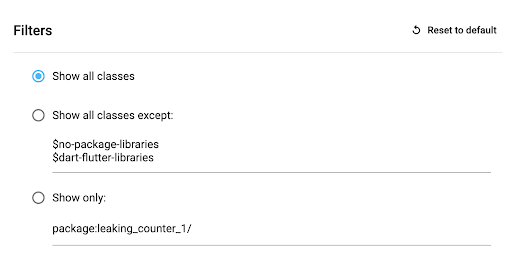
Tap the **Filter classes and packages** button,
to narrow the data:
点击 **Filter classes and packages**(筛选类和 package)按钮,
即可缩小数据范围:
筛选选项界面的截图
For a deeper analysis in Google Sheets
or other tools, download the data in CSV format.
如需在 Google Sheets 或其他工具中进行更深入的分析,
可以下载 CSV 格式的数据。
### Trace Instances tab
### Trace Instances(实例追踪)标签页
Use the **Trace Instances** tab to investigate what methods
allocate memory for a set of classes during feature execution:
使用 **Trace Instances**(实例追踪)标签页,
可以排查在某个功能执行期间,是哪些方法为一组类分配了内存:
1. Select classes to trace
选择要追踪的类
1. Interact with your app to trigger the code
you are interested in
与你的应用进行交互,以触发你关注的那部分代码
1. Tap **Refresh**
点击 **Refresh**(刷新)
1. Select a traced class
选择一个被追踪的类
1. Review the collected data
查看采集到的数据
{:width="100%"}
实例追踪标签页的截图
#### Bottom up vs call tree view
#### Bottom up vs call tree view(自底向上视图与调用树视图)
Switch between bottom-up and call tree views
depending on specifics of your tasks.
你可以根据具体任务的需要,
在自底向上 (bottom-up) 视图和调用树 (call tree) 视图之间切换。

内存分配追踪的截图
The call tree view shows the method allocations
for each instance. The view is a top-down representation
of the call stack, meaning that a method can be expanded
to show its callees.
调用树视图展示了每个实例的方法分配情况。
该视图是调用栈的自顶向下 (top-down) 呈现,
也就是说,可以展开某个方法以显示它所调用的方法 (callee)。
The bottom-up view shows the list of different
call stacks that have allocated the instances.
自底向上视图则展示了分配这些实例的各个不同调用栈的列表。
## Other resources
## 其他资源
For more information, check out the following resources:
想要了解更多信息,请查阅以下资源:
* To learn how to monitor an app's memory usage
and detect memory leaks using DevTools,
check out a guided [Memory View tutorial][memory-tutorial].
想要学习如何使用开发者工具监控应用的内存使用情况、
检测内存泄漏,
请查阅这篇带引导的 [内存视图教程][memory-tutorial]。
* To understand Android memory structure,
check out [Android: Memory allocation among processes][].
想要理解 Android 的内存结构,
请查阅 [Android:进程间的内存分配][Android: Memory allocation among processes]。
[memory-tutorial]: https://medium.com/@fluttergems/mastering-dart-flutter-devtools-memory-view-part-7-of-8-e7f5aaf07e15
[Android: Memory allocation among processes]: https://developer.android.google.cn/topic/performance/memory-management