# 使用 CPU 探测视图
> 了解如何使用 DevTools 的 CPU 探测视图。
:::note
The CPU profiler view works with Dart CLI and mobile apps only.
Use Chrome DevTools to [analyze performance][]
of a web app.
CPU 探测视图仅能在 Dart CLI 以及移动应用中使用。
请使用 Chrome DevTools [测量][analyze performance] web 应用的性能。
:::
The CPU profiler view allows you to record and profile a
session from your Dart or Flutter application.
The profiler can help you solve performance problems
or generally understand your app's CPU activity.
The Dart VM collects CPU samples
(a snapshot of the CPU call stack at a single point in time)
and sends the data to DevTools for visualization.
By aggregating many CPU samples together,
the profiler can help you understand where the CPU
spends most of its time.
借助 CPU 探测视图,你可以记录并测量来自 Dart 或 Flutter 应用的会话。
探测器可以帮助你解决性能问题,或者更好地理解应用的 CPU 活动。
Dart VM 收集 CPU 样本(在单个时间点上 CPU 调用栈的快照),
并将数据发送给 DevTools 以进行可视化。
通过聚合多个 CPU 样本,探测器可以帮助你了解 CPU 的大部分时间都花在了哪里。
:::note
**If you are running a Flutter application,
use a profile build to analyze performance.**
CPU profiles are not indicative of release performance
unless your Flutter application is run in profile mode.
**如果你正在运行 Flutter 应用,请在 profile 模式下测量性能。**
CPU 探测器无法测量 release 模式下的性能,你应该使用 profile 模式构建应用。
:::
## CPU profiler
## CPU profiler(CPU 探测器)
Start recording a CPU profile by clicking **Record**.
When you are done recording, click **Stop**. At this point,
CPU profiling data is pulled from the VM and displayed
in the profiler views (Call tree, Bottom up, Method table,
and Flame chart).
点击 **Record** 开始记录一份 CPU profile。
记录完成后,点击 **Stop**。此时,
CPU 探测数据会从 VM 中拉取,并显示在探测视图中
(Call tree、Bottom up、Method table 和 Flame chart)。
To load all available CPU samples without manually
recording and stopping, you can click **Load all CPU samples**,
which pulls all CPU samples that the VM has recorded and
stored in its sample buffer and then
displays those CPU samples in the profiler view.
如果你想加载所有可用的 CPU 样本,而无需手动记录和停止,
可以点击 **Load all CPU samples**,
它会拉取 VM 已记录并存储在其样本缓冲区中的所有 CPU 样本,
然后在探测视图中显示这些 CPU 样本。
By default, the VM's sample buffer is used as a ring buffer,
meaning that once it has become full, new samples start
overwriting the oldest ones in the buffer.
To make the VM instead discard all samples collected after
the sample buffer has become full,
pass the `--profile-startup` flag to `dart run` or `flutter run`.
默认情况下,VM 的样本缓冲区被用作环形缓冲区,
这意味着一旦它被填满,新的样本就会开始
覆盖缓冲区中最旧的样本。
如果你想让 VM 在样本缓冲区被填满后丢弃此后收集的所有样本,
请向 `dart run` 或 `flutter run` 传递 `--profile-startup` 标记。
### Bottom up
### Bottom up(自底向上)
This table provides a bottom-up representation
of a CPU profile. This means that each top-level method,
or root, in the bottom-up table is actually the
top method in the call stack for one or more CPU samples.
In other words, each top-level method in a bottom-up
table is a leaf node from the top-down table
(the call tree).
In this table, a method can be expanded to show its _callers_.
此表格提供了 CPU profile 的自底向上的呈现方式。
这意味着自底向上表格中的每个顶层方法(即根节点),
实际上是一个或多个 CPU 样本调用栈中的顶层方法。
换句话说,自底向上表格中的每个顶层方法,
都是自顶向下表格(即调用树)中的一个叶子节点。
在此表格中,一个方法可以展开以显示它的 **调用者**。
This view is useful for identifying expensive _methods_
in a CPU profile. When a root node in this table
has a high _self_ time, that means that many CPU samples
in this profile ended with that method on top of the call stack.
此视图有助于在 CPU profile 中识别开销较大的 **方法**。
当此表格中某个根节点的 **自身** 时间较高时,
意味着该 profile 中有许多 CPU 样本都以该方法位于调用栈顶层而结束。
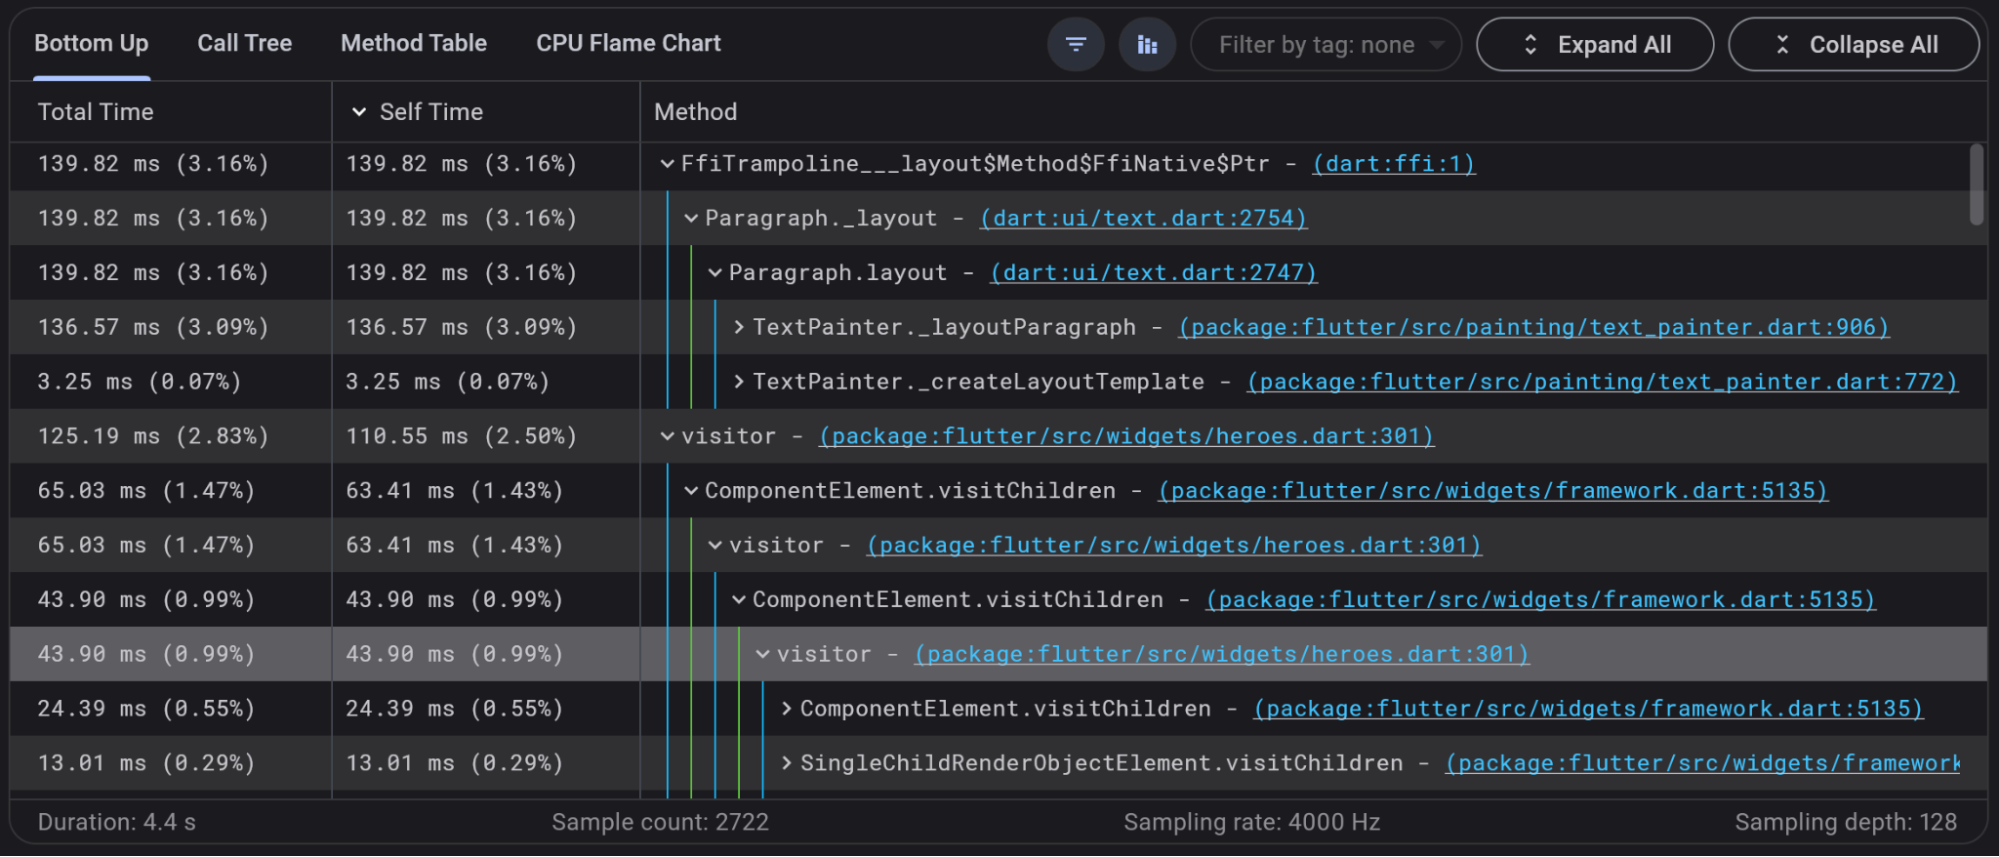
See the [Guidelines](#guidelines) section below to learn how to
enable the blue and green vertical lines seen in this image.
请参阅下方的 [参考线](#guidelines) 小节,
了解如何启用图中所示的蓝色和绿色竖线。
Tooltips can help you understand the values in each column:
工具提示可以帮助你理解每一列中的值:
**Total time**
For top-level methods in the bottom-up tree
(stack frames that were at the top of at least one
CPU sample), this is the time the method spent executing
its own code, as well as the code for any methods that
it called.
**Total time(总时长)**
对于自底向上树中的顶层方法
(位于至少一个 CPU 样本顶层的栈帧),
这是该方法用于执行其自身代码以及它所调用的任何方法的代码所花费的时间。
**Self time**
For top-level methods in the bottom-up tree
(stack frames that were at the top of at least one CPU
sample), this is the time the method spent executing only
its own code.
For children methods in the bottom-up tree (the callers),
this is the self time of the top-level method (the callee)
when called through the child method (the caller).
**Self time(自身时长)**
对于自底向上树中的顶层方法
(位于至少一个 CPU 样本顶层的栈帧),
这是该方法仅用于执行其自身代码所花费的时间。
对于自底向上树中的子级方法(即调用者),
这是顶层方法(即被调用者)在通过该子级方法(即调用者)被调用时的自身时间。
**Table element** (self time)
**表格元素**(Self time(自身时长))

### Call tree
### Call tree(调用树)
This table provides a top-down representation of a CPU profile.
This means that each top-level method in the call tree is a root
of one or more CPU samples. In this table,
a method can be expanded to show its _callees_.
此表格提供了 CPU profile 的自顶向下的呈现方式。
这意味着调用树中的每个顶层方法都是一个或多个 CPU 样本的根节点。
在此表格中,一个方法可以展开以显示它的 **被调用者**。
This view is useful for identifying expensive _paths_ in a CPU profile.
When a root node in this table has a high _total_ time,
that means that many CPU samples in this profile started
with that method on the bottom of the call stack.
此视图有助于在 CPU profile 中识别开销较大的 **路径**。
当此表格中某个根节点的 **总** 时间较高时,
意味着该 profile 中有许多 CPU 样本都以该方法位于调用栈底层而开始。

See the [Guidelines](#guidelines) section below to learn how to
enable the blue and green vertical lines seen in this image.
请参阅下方的 [参考线](#guidelines) 小节,
了解如何启用图中所示的蓝色和绿色竖线。
Tooltips can help you understand the values in each column:
工具提示可以帮助你理解每一列中的值:
**Total time**
Time that a method spent executing its own code as well as
the code for any methods it called.
**Total time(总时长)**
一个方法用于执行其自身代码以及它所调用的任何方法的代码所花费的时间。
**Self time**
Time the method spent executing only its own code.
**Self time(自身时长)**
一个方法仅用于执行其自身代码所花费的时间。
### Method table
### Method table(方法表)
The method table provides CPU statistics for each method
contained in a CPU profile. In the table on the left,
all available methods are listed with their **total** and
**self** time.
方法表为 CPU profile 中包含的每个方法提供了 CPU 统计信息。
在左侧的表格中,所有可用的方法都会列出它们的 **total**(总)
和 **self**(自身)时间。
**Total** time is the combined time that a method spent
**anywhere** on the call stack, or in other words,
the time a method spent executing its own code and
any code for methods that it called.
**Total**(总)时间是一个方法在调用栈中 **任何位置** 所花费时间的总和,
换句话说,就是一个方法用于执行其自身代码以及它所调用的任何方法的代码所花费的时间。
**Self** time is the combined time that a method spent
on top of the call stack, or in other words,
the time a method spent executing only its own code.
**Self**(自身)时间是一个方法在调用栈顶层所花费时间的总和,
换句话说,就是一个方法仅用于执行其自身代码所花费的时间。

Selecting a method from the table on the left shows
the call graph for that method. The call graph shows
a method's callers and callees and their respective
caller / callee percentages.
从左侧的表格中选择一个方法,会显示该方法的调用图。
调用图会展示一个方法的调用者和被调用者,
以及它们各自的调用者 / 被调用者百分比。
### Flame chart
### Flame chart(火焰图)
The flame chart view is a graphical representation of
the [Call tree](#call-tree). This is a top-down view
of a CPU profile, so in this chart,
the top-most method calls the one below it.
The width of each flame chart element represents the
amount of time that a method spent on the call stack.
火焰图视图是 [调用树](#call-tree) 的图形化呈现。
它是 CPU profile 的自顶向下视图,所以在此图中,
最顶层的方法调用它下面的方法。
每个火焰图元素的宽度表示一个方法在调用栈上所花费的时间。
Like the Call tree, this view is useful for identifying
expensive paths in a CPU profile.
与调用树类似,此视图有助于在 CPU profile 中识别开销较大的路径。
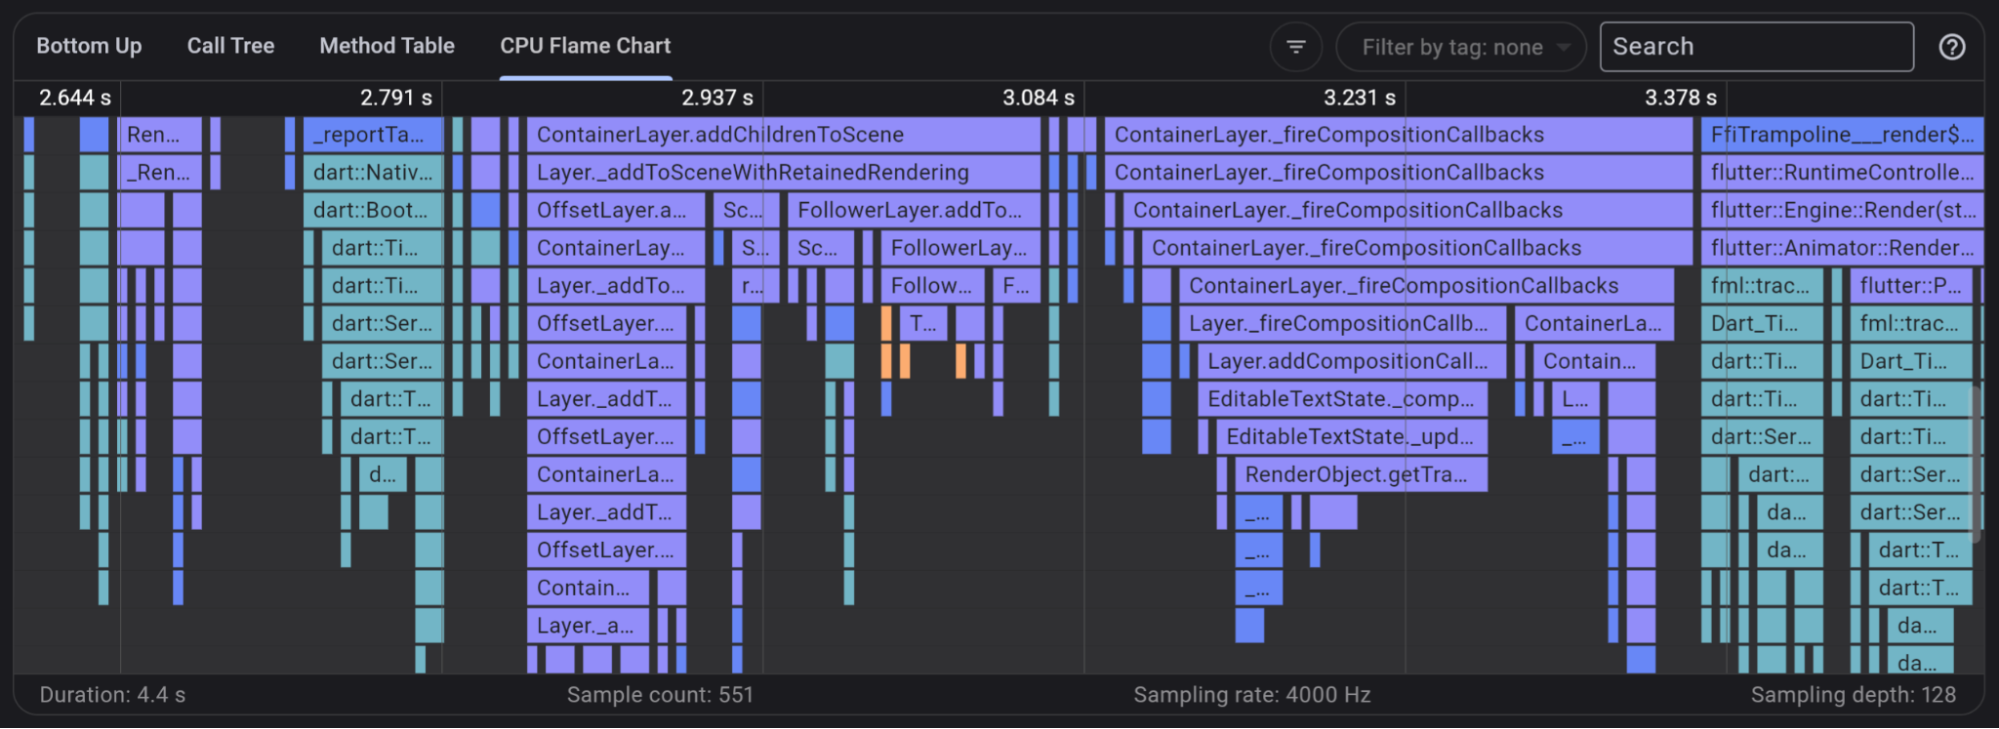
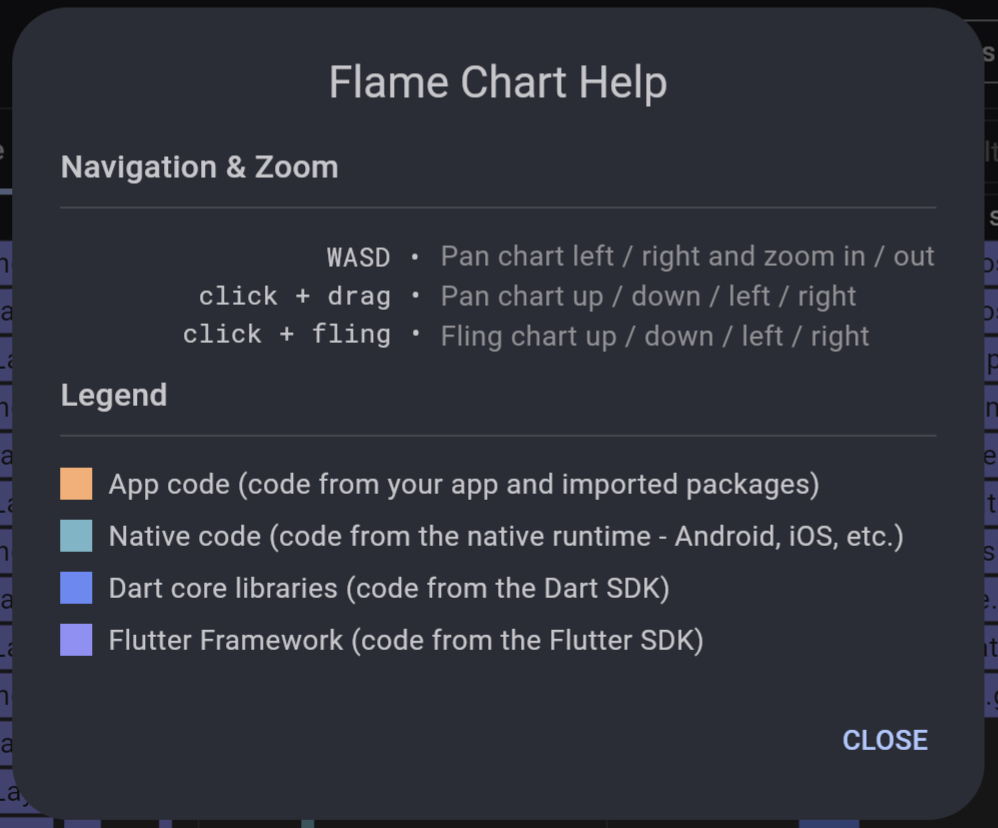
The help menu, which can be opened by clicking the `?` icon
next to the search bar, provides information about how to
navigate and zoom within the chart and a color-coded legend.
{:width="70%"}
点击搜索栏旁边的 `?` 图标可以打开帮助菜单,
它提供了关于如何在图中导航和缩放的信息,以及一份颜色编码的图例。
### CPU sampling rate
### CPU sampling rate(CPU 采样率)
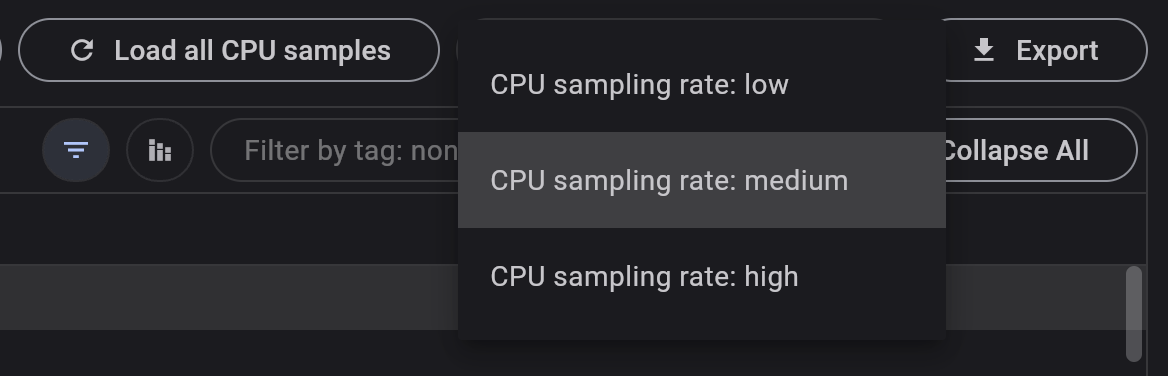
DevTools sets a rate at which the VM collects CPU samples:
1 sample / 250 μs (microseconds).
This is selected by default on
the CPU profiler page as "Cpu sampling rate: medium".
This rate can be modified using the selector at the top
of the page.
DevTools 设定了一个 VM 收集 CPU 样本的速率:
每 250 μs(微秒)1 个样本。
在 CPU 探测器页面上,它默认被选为 “Cpu sampling rate: medium”。
你可以使用页面顶部的选择器来修改这个速率。
{:width="70%"}
The **low**, **medium**, and **high** sampling rates are
1,000 Hz, 4,000 Hz, and 20,000 Hz, respectively.
It's important to know the trade-offs
of modifying this setting.
**low**(低)、**medium**(中)和 **high**(高)采样率
分别为 1,000 Hz、4,000 Hz 和 20,000 Hz。
了解修改此设置所带来的取舍是很重要的。
A profile that was recorded with a **higher** sampling rate
yields a more fine-grained CPU profile with more samples.
This might affect performance of your app since the VM
is being interrupted more often to collect samples.
This also causes the VM's CPU sample buffer to overflow more quickly.
The VM has limited space where it can store CPU sample information.
At a higher sampling rate, the space fills up and begins
to overflow sooner than it would have if a lower sampling
rate was used.
This means that you might not have access to CPU samples
from the beginning of the recorded profile, depending
on whether the buffer overflows during the time of recording.
以 **更高** 的采样率记录的 profile 会产生一份更细粒度、样本更多的 CPU profile。
这可能会影响你应用的性能,因为 VM 为了收集样本会被更频繁地中断。
这也会导致 VM 的 CPU 样本缓冲区更快地溢出。
VM 用于存储 CPU 样本信息的空间是有限的。
在更高的采样率下,这块空间会比使用更低采样率时更快地被填满并开始溢出。
这意味着,你可能无法访问到所记录 profile 开头部分的 CPU 样本,
具体取决于缓冲区是否在记录期间溢出。
A profile that was recorded with a lower sampling rate
yields a more coarse-grained CPU profile with fewer samples.
This affects your app's performance less,
but you might have access to less information about what
the CPU was doing during the time of the profile.
The VM's sample buffer also fills more slowly, so you can see
CPU samples for a longer period of app run time.
This means that you have a better chance of viewing CPU
samples from the beginning of the recorded profile.
以更低的采样率记录的 profile 会产生一份更粗粒度、样本更少的 CPU profile。
它对你应用性能的影响较小,
但你可能只能访问到关于 profile 期间 CPU 行为的较少信息。
VM 的样本缓冲区也会更慢地被填满,所以你可以看到应用运行更长时间段的 CPU 样本。
这意味着你有更大的机会查看到所记录 profile 开头部分的 CPU 样本。
### Filtering
### Filtering(过滤)
When viewing a CPU profile, you can filter the data by
library, method name, or [`UserTag`][].
在查看 CPU profile 时,你可以按库、方法名或 [`UserTag`][] 来过滤数据。

[`UserTag`]: https://api.flutter-io.cn/flutter/dart-developer/UserTag-class.html
## Guidelines
## Guidelines(参考线)
When looking at a call tree or bottom up view,
sometimes the trees can be very deep.
To help with viewing parent-child relationships in a deep tree,
enable the **Display guidelines** option.
This adds vertical guidelines between parent and child in the tree.
在查看调用树或自底向上视图时,有时树的层级会非常深。
为了帮助你在深层树中查看父子关系,
请启用 **Display guidelines** 选项。
它会在树的父级与子级之间添加竖向的参考线。

[analyze performance]: https://developers.google.cn/web/tools/chrome-devtools/evaluate-performance/
## Other resources
## 其他资源
To learn how to use DevTools to analyze
the CPU usage of a compute-intensive Mandelbrot app,
check out a guided [CPU Profiler View tutorial][profiler-tutorial].
Also, learn how to analyze CPU usage when the app
uses isolates for parallel computing.
要了解如何使用 DevTools 分析计算密集型 Mandelbrot 应用的 CPU 使用情况,
请查看 [CPU 探测视图教程][profiler-tutorial]。
此外,还可以了解应用在使用隔离区进行并行计算时的 CPU 使用情况。
[profiler-tutorial]: https://medium.com/@fluttergems/mastering-dart-flutter-devtools-cpu-profiler-view-part-6-of-8-31e24eae6bf8