# 在 Android Studio 或 IntelliJ 里开发 Flutter 应用
> 如何在 Android Studio 或者其他类 IntelliJ 产品里开发 Flutter 应用。
## Installation and setup {: #setup}
## 安装和配置
Android Studio and IntelliJ IDEA offer a complete,
IDE experience once you install the Flutter plugin.
安装 Flutter 插件后,
Android Studio 和 IntelliJ IDEA 将提供完整的 IDE 体验。
To install the latest version of the following IDEs, follow their instructions:
要安装以下最新版本的 IDE,请按照其说明进行操作:
- [Android Studio][]
- [IntelliJ IDEA Community][]
- [IntelliJ IDEA Ultimate][]
[Android Studio]: https://developer.android.google.cn/studio/install
[IntelliJ IDEA Community]: https://www.jetbrains.com/idea/download/
[IntelliJ IDEA Ultimate]: https://www.jetbrains.com/idea/download/
### Install the Flutter plugin {: #install-plugin}
### 安装 Flutter 插件
1. Go to **File** >
**Settings**.
打开 **File** >
**Settings**。
You can also press Ctrl + Alt +
S.
你也可以使用快捷键:Ctrl + Alt +
S。
The **Preferences** dialog opens.
此时将打开 **Preferences** 对话框。
1. From the list at the left, select **Plugins**.
从左侧列表中选择 **Plugins**。
1. From the top of this panel, select **Marketplace**.
从该面板顶部选择 **Marketplace**。
1. Type `flutter` in the plugin search field.
在插件搜索栏中输入 `flutter`。
1. Select the **Flutter** plugin.
选择 **Flutter** 插件。
1. Click **Install**.
点击 **Install**。
1. Click **Yes** when prompted to install the plugin.
在提示安装插件时点击 **Yes**。
1. Click **Restart** when prompted.
在出现提示时点击 **Restart**。
1. Start Android Studio or IntelliJ.
启动 Android Studio 或 IntelliJ。
1. From the macOS menu bar, go to **Android Studio** (or **IntelliJ**)
> **Settings...**.
从 macOS 菜单栏进入 **Android Studio** (或 **IntelliJ**)
> **Settings...**。
You can also press Cmd + ,.
你也可以使用快捷键:Cmd + ,。
The **Preferences** dialog opens.
此时将打开 **Preferences** 对话框。
1. From the list at the left, select **Plugins**.
从左侧列表中选择 **Plugins**。
1. From the top of this panel, select **Marketplace**.
从该面板顶部选择 **Marketplace**。
1. Type `flutter` in the plugin search field.
在插件搜索栏中输入 `flutter`。
1. Select the **Flutter** plugin.
选择 **Flutter** 插件。
1. Click **Install**.
点击 **Install**。
1. Click **Yes** when prompted to install the plugin.
在提示安装插件时点击 **Yes**。
1. Click **Restart** when prompted.
在出现提示时点击 **Restart**。
1. Go to **File** >
**Settings**.
打开 **File** >
**Settings**。
You can also press Ctrl + Alt +
S.
你也可以使用快捷键:Ctrl + Alt +
S。
The **Preferences** dialog opens.
此时将打开 **Preferences** 对话框。
1. From the list at the left, select **Plugins**.
从左侧列表中选择 **Plugins**。
1. From the top of this panel, select **Marketplace**.
从该面板顶部选择 **Marketplace**。
1. Type `flutter` in the plugin search field.
在插件搜索栏中输入 `flutter`。
1. Select the **Flutter** plugin.
选择 **Flutter** 插件。
1. Click **Install**.
点击 **Install**。
1. Click **Yes** when prompted to install the plugin.
在提示安装插件时点击 **Yes**。
1. Click **Restart** when prompted.
在出现提示时点击 **Restart**。
### Updating the plugins {:#updating}
### 更新插件
Updates to the plugins are shipped on a regular basis.
You should be prompted in the IDE when an update is available.
插件的更新会定期发布,当有更新可用时,你会在 IDE 中收到提示。
To check for updates manually:
手动检查更新:
1. Open preferences (**Android Studio > Check for Updates** on macOS,
**Help > Check for Updates** on Linux).
打开设置(在 macOS 中点击 **Android Studio > Check for Updates**,在 Linux 中点击
**Help > Check for Updates**)。
1. If `dart` or `flutter` are listed, update them.
如果存在 `dart` 或 `flutter`,更新它们。
## Creating projects
## 创建项目
You can create a new project in one of several ways.
你可以通过多种方式来创建新项目。
### Creating a new project
### 创建新项目
Creating a new Flutter project from the Flutter starter app template
differs between Android Studio and IntelliJ.
从 Flutter 起始应用模板创建新 Flutter 项目在
Android Studio 和 IntelliJ 中有所不同。
**In Android Studio:**
**在 Android Studio 中:**
1. In the IDE, click **New Flutter Project** from the **Welcome** window or
**File > New > New Flutter Project** from the main IDE window.
在 IDE 中,点击 **Welcome** 窗口中的 **New Flutter Project**,或者主窗口中的
**File > New > New Flutter Project**。
1. Specify the **Flutter SDK path** and click **Next**.
指定 **Flutter SDK path**,点击 **Next**。
1. Enter your desired **Project name**,
**Description**, and **Project location**.
输入你想要的 **Project name**,**Description**
和 **Project location**。
1. If you might publish this app,
[set the company domain](#set-the-company-domain).
如果你打算发布此应用,
需要 [设置公司域名](#set-the-company-domain)。
1. Click **Finish**.
点击 **Finish**。
**In IntelliJ:**
**在 IntelliJ 中:**
1. In the IDE, click **New Project** from the **Welcome** window or
**File > New > Project** from the main IDE window.
在 IDE 中,点击 **Welcome** 窗口中的 **New Project**,或者主窗口中的
**File > New > Project**。
1. Select **Flutter** from the **Generators** list in the left panel
在左侧面板的 **Generators** 列表中选择 **Flutter**。
1. Specify the **Flutter SDK path** and click **Next**.
指定 **Flutter SDK path**,点击 **Next**。
1. Enter your desired **Project name**,
**Description**, and **Project location**.
输入你想要的 **Project name**,**Description**
和 **Project location**。
1. If you might publish this app,
[set the company domain](#set-the-company-domain).
如果你打算发布此应用,
需要 [设置公司域名](#set-the-company-domain)。
1. Click **Finish**.
点击 **Finish**。
#### Set the company domain
#### 设置公司域名
When creating a new app, some Flutter IDE plugins ask for an
organization name in reverse domain order,
something like `com.example`. Along with the name of the app,
this is used as the package name for Android, and the Bundle ID for iOS
when the app is released. If you think you might ever release this app,
it is better to specify these now. They cannot be changed once the app
is released. Your organization name should be unique.
在创建新应用时,一些 Flutter IDE 插件需要一个逆序的域名,比如 `com.example`。
除了程序名外,在应用发布后,它将作为 Android 应用的包名,以及 iOS 应用的 Bundle ID。
如果你可能发布此应用,最好现在就指定好它,应用发布后将无法更改。你的域名应该是唯一的。
### Opening a project from existing source code
### 从现有源码创建新项目
To open an existing Flutter project:
打开现有的 Flutter 项目:
1. In the IDE, click **Open** from the **Welcome** window, or
**File > Open** from the main IDE window.
在 IDE 中,点击 **Welcome** 窗口中的 **Open**,或者主窗口中的
**File > Open**。
1. Browse to the directory holding your existing
Flutter source code files.
浏览到现有 Flutter 源码的文件目录。
1. Click **Open**.
点击 **Open**。
:::important
Do *not* use the **New > Project from existing sources**
option for Flutter projects.
对于 Flutter 项目,请 **不要** 使用 **New > Project from existing sources**。
:::
## Editing code and viewing issues
## 编辑代码,和查看问题
The Flutter plugin performs code analysis that enables the following:
Flutter 插件的代码分析,可以做到:
* Syntax highlighting.
语法高亮显示。
* Code completions based on rich type analysis.
基于多种类型分析的代码补全。
* Navigating to type declarations (**Navigate > Declaration**),
and finding type usages (**Edit > Find > Find Usages**).
定位到类型的声明(**Navigate > Declaration**),
查找类型的引用(**Edit > Find > Find Usages**)。
* Viewing all current source code problems
(**View > Tool Windows > Dart Analysis**).
Any analysis issues are shown in the Dart Analysis pane:
{:width="90%"}
查看当前存在的代码问题(**View > Tool Windows > Dart Analysis**),
所有问题会在 Dart Analysis 窗口中显示
{:width="90%"}
## Running and debugging
## 运行和调试
:::note
You can debug your app in a few ways.
你可以通过如下方式调试你的应用:
* Using [DevTools][], a suite of debugging and profiling
tools that run in a browser
_and include the Flutter inspector_.
使用 [开发者工具 (DevTools)][DevTools],
运行在浏览器里的一系列调试和分析工具,
**也包括 Flutter inspector**。
* Using Android Studio's (or IntelliJ's) built-in debugging
features, such as the ability to set breakpoints.
使用 Android Studio(或者 IntelliJ)内置的调试功能,
比如设置断点等。
* Using the Flutter inspector, directly available in
Android Studio and IntelliJ.
使用 Flutter inspector,它直接内置于 Android Studio 和 IntelliJ 中。
The instructions below describe features available in Android
Studio and IntelliJ. For information on launching DevTools,
see [Running DevTools from Android Studio][] in the
[DevTools][] docs.
下面的介绍文章适用于 Android Studio 和 IntelliJ,更多关于开发者工具的信息,
请参看文档:[在 Android Studio 上安装和运行开发者工具][Running DevTools from Android Studio]。
:::
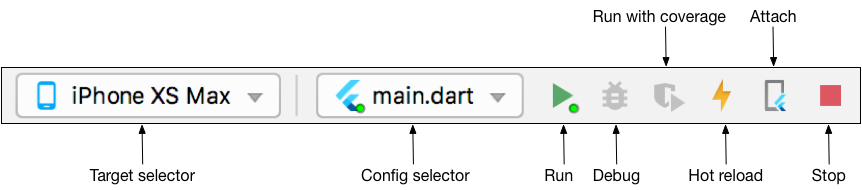
Running and debugging are controlled from the main toolbar:
在主工具栏,可以运行和调试代码:
{:width="90%"}
### Selecting a target
### 选择目标设备
When a Flutter project is open in the IDE, you should see a set of
Flutter-specific buttons on the right-hand side of the toolbar.
在 IDE 中打开 Flutter 项目时,你会在工具栏的右侧看到一组 Flutter 的特定按钮。
:::note
If the Run and Debug buttons are disabled, and no targets are listed,
Flutter has not been able to discover any connected iOS or
Android devices or simulators.
You need to connect a device, or start a simulator, to proceed.
如果 Run 和 Debug 按钮不可用,且未显示目标设备,则意味着
Flutter 未发现任何已连接的 iOS 、Android 设备或模拟器。
你需要连接设备或启动模拟器才能继续。
:::
1. Locate the **Flutter Target Selector** drop-down button.
This shows a list of available targets.
找到**选择目标**下拉按钮,点击它会显示出可用设备列表。
2. Select the target you want your app to be started on.
When you connect devices, or start simulators,
additional entries appear.
选择你希望启动应用的设备。当连接设备或启动模拟器时,
列表中将会加入新选项。
### Run app without breakpoints
### 不使用断点运行应用
1. Click the **Play icon** in the toolbar, or invoke **Run > Run**.
The bottom **Run** pane shows logs output.
点击工具栏中的 **Play** 按钮,或选择 **Run > Run**。
底部的 **Run** 窗口会有日志输出:
### Run app with breakpoints
### 使用断点运行应用
1. If desired, set breakpoints in your source code.
如果需要,在源代码中设置断点。
1. Click the **Debug icon** in the toolbar, or invoke **Run > Debug**.
点击工具栏中的 **Debug** 按钮,或选择 **Run > Debug**。
* The bottom **Debugger** pane shows Stack Frames and Variables.
底部的 **Debugger** 窗口会显示出堆栈和变量信息。
* The bottom **Console** pane shows detailed logs output.
底部的 **Console** 窗口会显示详细的日志输出。
* Debugging is based on a default launch configuration.
To customize this, click the drop-down button to the right
of the device selector, and select **Edit configuration**.
调试基于默认的启动配置,如果需要自定义,点击**选择目标**下拉按钮,
选择 **Edit configuration** 进行配置。
## Fast edit and refresh development cycle
## 快速编辑和查看效果
Flutter offers a best-in-class developer cycle enabling you to see the effect
of your changes almost instantly with the _Stateful Hot Reload_ feature.
To learn more, check out [Hot reload][].
Flutter 有效加快开发周期。使用 **热重载** 功能,你可以在修改源码后,几乎马上看到效果。
详细信息请查阅 [使用热重载][Hot reload]。
### Show performance data
### 显示性能数据
:::note
To examine performance issues in Flutter, see the
[Timeline view][].
检查 Flutter 里的性能问题,请查看
[时间线视图文档][Timeline view]。
:::
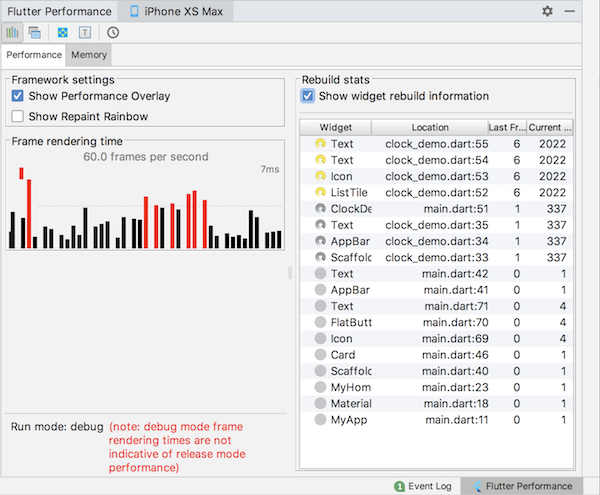
To view the performance data, including the widget rebuild
information, start the app in **Debug** mode, and then open
the Performance tool window using
**View > Tool Windows > Flutter Performance**.
在 **Debug** 模式下启动应用后,使用
**View > Tool Windows > Flutter Performance**
打开性能工具窗口,以查看性能数据以及 widget 的 rebuild 信息。
{:width="90%"}
To see the stats about which widgets are being rebuilt, and how often,
click **Show widget rebuild information** in the **Performance** pane.
The exact count of the rebuilds for this frame displays in the second
column from the right. For a high number of rebuilds, a yellow spinning
circle displays. The column to the far right shows how many times a
widget was rebuilt since entering the current screen.
For widgets that aren't rebuilt, a solid grey circle displays.
Otherwise, a grey spinning circle displays.
点击 **Performance** 窗口中的 **Show widget rebuild information**,
查看正在重载的 widget 统计信息和重载频率。
右边第二列显示了所在框架的重载次数。
如果重载次数过多,会显示一个黄色旋转圆圈。
最右一列显示了进入当前页面后 widget 的重载次数。
对于未重载的 widget,将显示一个灰色圆圈,否则将显示一个灰色旋转圆圈。
:::secondary
The app shown in this screenshot has been designed to deliver
poor performance, and the rebuild profiler gives you a clue
about what is happening in the frame that might cause poor
performance. The widget rebuild profiler is not a diagnostic
tool, by itself, about poor performance.
截图中的应用性能较差,通过重载分析器,你可以找到导致性能差的线索。
重载分析器不是一个性能诊断工具,但它和性能有关。
:::
The purpose of this feature is to make you aware when widgets are
rebuilding—you might not realize that this is happening when just
looking at the code. If widgets are rebuilding that you didn't expect,
it's probably a sign that you should refactor your code by splitting
up large build methods into multiple widgets.
该功能的目的是让你了解 widget 是何时重载的,只看代码的话可能不好发现。
如果 widget 在你预想不到的情况下发生了重载,
说明你可能需要重构代码,将大型的构建方法拆分成多个 widget。
This tool can help you debug at least four common performance issues:
该工具可以帮助你调试至少四个常见的性能问题:
1. The whole screen (or large pieces of it) are built by a single
StatefulWidget, causing unnecessary UI building. Split up the
UI into smaller widgets with smaller `build()` functions.
整个屏幕(或大部分屏幕)由一个 StatefulWidget 构成,导致不必要的 UI 构建。
可将 UI 拆分成多个具有较轻量 `build()` 方法的 widget。
1. Offscreen widgets are being rebuilt. This can happen, for example,
when a ListView is nested in a tall Column that extends offscreen.
Or when the RepaintBoundary is not set for a list that extends
offscreen, causing the whole list to be redrawn.
未在屏幕上显示的 widget 发生了重载。例如,一个延伸到屏幕外的 ListView,
或者未给延伸到屏幕外的列表设置 RepaintBoundary,会导致重绘整个列表。
1. The `build()` function for an AnimatedBuilder draws a subtree that
does not need to be animated, causing unnecessary rebuilds of static
objects.
AnimatedBuilder 的 `build()` 方法绘制了一个不需要动画的子树,
导致不必要的静态对象重载。
1. An Opacity widget is placed unnecessarily high in the widget tree.
Or, an Opacity animation is created by directly manipulating the
opacity property of the Opacity widget, causing the widget itself
and its subtree to rebuild.
一个 Opacity widget 在 widget tree 中使用了一个不必要的高度,
或者通过直接操作 Opacity widget 的透明属性创建 Opacity 动画,
导致 widget 和它的子树重载。
You can click on a line in the table to navigate to the line
in the source where the widget is created. As the code runs,
the spinning icons also display in the code pane to help you
visualize which rebuilds are happening.
你可以点击表格中的一行,定位到创建指定 widget 的源码位置。
随着代码的运行,旋转图标也会在代码窗口中显示,以帮助你观察正在进行的重载。
Note that numerous rebuilds doesn't necessarily indicate a problem.
Typically you should only worry about excessive rebuilds if you have
already run the app in profile mode and verified that the performance
is not what you want.
大量的重载并不一定表示存在问题。
通常情况下,只有当你通过分析发现性能不理想时,才需要考虑过度重载的问题。
And remember, _the widget rebuild information is only available in
a debug build_. Test the app's performance on a real device in a profile
build, but debug performance issues in a debug build.
记住,**widget 的重载信息只在 debug 版本中可用**,
在真机上使用分析构建 (profile build) 进行应用性能分析,
使用调试构建 (debug build) 进行性能问题调试。
## Editing tips for Flutter code
## Flutter 代码编辑提示
If you have additional tips we should share, [let us know][]!
如果你有其他我们应该提供的代码提示建议,请 [告诉我们][let us know]!
### Assists & quick fixes
### 代码辅助和快速修复

Assists are code changes related to a certain code identifier.
A number of these are available when the cursor is placed on a
Flutter widget identifier, as indicated by the yellow lightbulb icon.
The assist can be invoked by clicking the lightbulb, or by using the
keyboard shortcut (`Alt`+`Enter` on Linux and Windows,
`Option`+`Return` on macOS), as illustrated here:
代码辅助功能是特定代码标识符相关的代码修改。
当光标放在 Flutter widget 上时,黄色灯泡图标会指示可用的修改,
可以通过点击灯泡进行修改,
或使用键盘快捷键
(在 Linux 和 Windows 上使用 `Alt`+`Enter`,在 macOS 上使用 `Option`+`Return`),
如下图所示:
{:width="100%"}
Quick Fixes are similar, only they are shown with a piece of code has an error
and they can assist in correcting it. They are indicated with a red lightbulb.
Quick Fixes 快速修复功能也是类似的,当一段代码存在错误时,
它会出现并帮助纠正错误。它使用红色灯泡表示。
#### Wrap with new widget assist
#### Widget 嵌套辅助
This can be used when you have a widget that you want to wrap in a surrounding
widget, for example if you want to wrap a widget in a `Row` or `Column`.
当你有一个 widget 需要嵌套在其他 widget 时,可以使用该功能。
例如,需要将 widget 嵌套在 `Row` 或 `Column` 中。
#### Wrap widget list with new widget assist
#### Widget 列表嵌套辅助
Similar to the assist above, but for wrapping an existing list of
widgets rather than an individual widget.
和上面的辅助类似,但它嵌套的是一个 widget 的列表,而不是单个的 widget。
#### Convert child to children assist
#### child 和 children 转换辅助
Changes a child argument to a children argument,
and wraps the argument value in a list.
将 child 转换成 children,并且把参数值写进一个 list。
### Live templates
### 实时模板

Live templates can be used to speed up entering typical code structures.
They are invoked by typing their prefix, and then selecting it in the code
completion window:
实时模板用于增加典型代码结构的输入速度。输入前缀后,在代码完成窗口中选择它:
{:width="100%"}
The Flutter plugin includes the following templates:
Flutter 插件包含了以下模板:
* Prefix `stless`: Create a new subclass of `StatelessWidget`.
前缀 `stless`:创建一个 `StatelessWidget` 的子类。
* Prefix `stful`: Create a new subclass of `StatefulWidget` and
its associated State subclass.
前缀 `stful`:创建一个 `StatefulWidget` 的子类,并关联 State 子类。
* Prefix `stanim`: Create a new subclass of `StatefulWidget` and its
associated State subclass, including a field initialized with an
`AnimationController`.
前缀 `stanim`:创建一个 `StatefulWidget` 的子类,并关联 State 子类,
包含一个 `AnimationController` 的初始化字段。
You can also define custom templates in **Settings > Editor > Live Templates**.
你还可以通过 **Settings > Editor > Live Templates** 定义自定义模板。
### Keyboard shortcuts
### 键盘快捷键
**Hot reload**
**热重载**
On Linux (keymap _Default for XWin_) and Windows the keyboard shortcuts
are `Control`+`Alt`+`;` and `Control`+`Backslash`.
在 Linux(映射方案默认为 **XWin**)和 Windows 上,
快捷键是 `Control`+`Alt`+`;` 和 `Control`+`Backslash`。
On macOS (keymap _Mac OS X 10.5+ copy_) the keyboard shortcuts are
`Command`+`Option` and `Command`+`Backslash`.
在 macOS 上(映射方案 **Mac OS X 10.5+**),
快捷键是 `Command`+`Option` 和 `Command`+`Backslash`。
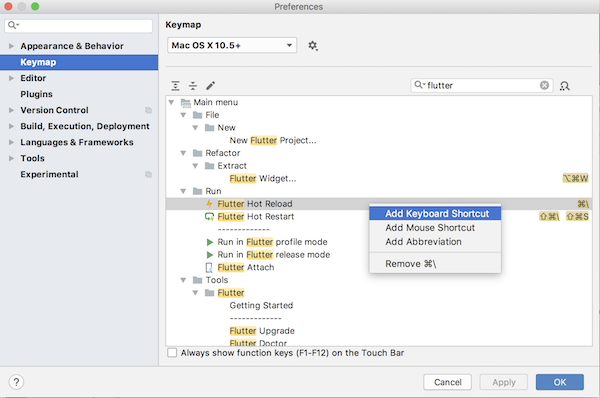
Keyboard mappings can be changed in the IDE Preferences/Settings: Select
*Keymap*, then enter _flutter_ into the search box in the upper right corner.
Right click the binding you want to change and _Add Keyboard Shortcut_.
可以在 IDE 的设置中修改快捷键:选择 **Keymap** 后,
在右上角的搜索框输入 **flutter**。
右键点击你想修改的快捷键,点击 **Add Keyboard Shortcut**。
{:width="100%"}
### Hot reload vs. hot restart
### 热重载和热重启
Hot reload works by injecting updated source code files into the running
Dart VM (Virtual Machine). This includes not only adding new classes,
but also adding methods and fields to existing classes,
and changing existing functions.
A few types of code changes cannot be hot reloaded though:
热重载的工作原理是将更新后的代码注入 Dart VM(虚拟机)。
不仅包括添加新类,还包括添加方法和字段到已有的类中。
但有些类型的代码是无法被热重载的:
* Global variable initializers
全局变量的初始化
* Static field initializers
静态变量的初始化
* The `main()` method of the app
应用的 `main()` 方法
For these changes you can fully restart your application,
without having to end your debugging session. To perform a hot restart,
don't click the Stop button, simply re-click the Run button (if in a run
session) or Debug button (if in a debug session), or shift-click the 'hot
reload' button.
对于这些更改,你无需结束调试过程而直接热重启 (hot restart) 你的应用:
不要点击 Stop 按钮,只需点击 Run 按钮(在运行中),或 Debug 按钮(在调试中),
或者按住 Shift 键点击热重载按钮。
## Editing Android code in Android Studio with full IDE support {:#android-ide}
## 在 Android Studio 中编辑 Android 代码,并获得完整 IDE 支持
Opening the root directory of a Flutter project doesn't expose all the Android
files to the IDE. Flutter apps contain a subdirectory named `android`. If you
open this subdirectory as its own separate project in Android Studio, the IDE
will be able to fully support editing and refactoring all Android files (like
Gradle scripts).
打开 Flutter 项目的根目录,并不会在 IDE 中显示所有的 Android 文件。
Flutter 应用包含了一个名为 `android` 的子目录,
如果你在 Android Studio 中将该目录作为单独的项目打开,
则 IDE 将可以完全支持编辑和重构所有的 Android 文件(比如 Gradle 脚本文件)。
If you already have the entire project opened as a Flutter app in Android
Studio, there are two equivalent ways to open the Android files on their own
for editing in the IDE. Before trying this, make sure that you're on the latest
version of Android Studio and the Flutter plugins.
如果你已经在 Android Studio 中将整个项目作为 Flutter 应用打开,
则有两种方法可以打开 Android 文件,在 IDE 中进行编辑。
在进行操作之前,请确保你使用的是最新版本的 Android Studio 和 Flutter 插件。
* In the ["project view"][], you should see a subdirectory immediately under
the root of your flutter app named `android`. Right click on it,
then select **Flutter > Open Android module in Android Studio**.
在 [“项目视图 (project view)”]["project view"] 中,
你可以在 flutter 应用的根目录下看到一个 `android` 的子目录。
右键点击它,选择 **Flutter > Open Android module in Android Studio**。
* OR, you can open any of the files under the `android` subdirectory for
editing. You should then see a "Flutter commands" banner at the top of the
editor with a link labeled **Open for Editing in Android Studio**.
Click that link.
或者,你也可以打开 `android` 目录下的任意文件进行编辑。
你会在编辑器的顶部看到一个 "Flutter commands" 的横幅,
包含一个 **Open for Editing in Android Studio** 的标签,点击它。
For both options, Android Studio gives you the option to use separate windows or
to replace the existing window with the new project when opening a second
project. Either option is fine.
这两种方法,Android Studio 都让你选择使用单独的窗口,
或替换现有窗口打开新项目,两种都是可以的。
If you don't already have the Flutter project opened in Android studio,
you can open the Android files as their own project from the start:
如果你还没在 Android Studio 中打开 Flutter 项目,你可以一开始就将 Android 文件作为项目打开:
1. Click **Open an existing Android Studio Project** on the Welcome
splash screen, or **File > Open** if Android Studio is already open.
点击欢迎窗口中的 **Open an existing Android Studio Project**。
如果 Android Studio 已打开,也可以点击 **File > Open**。
2. Open the `android` subdirectory immediately under the flutter app root.
For example if the project is called `flutter_app`,
open `flutter_app/android`.
打开 flutter 应用根目录下的 `android` 子目录。
例如,项目名为 `flutter_app`,则打开 `flutter_app/android`。
If you haven't run your Flutter app yet, you might see Android Studio report a
build error when you open the `android` project. Run `flutter pub get` in
the app's root directory and rebuild the project by selecting **Build > Make**
to fix it.
如果你还未运行过你的 Flutter 应用,可能会在打开 `android` 项目时,
看到 Android Studio 构建失败的报告。运行项目根目录的 `flutter pub get`,
并通过点击 **Build > Make** 重建项目,可修复该问题。
## Editing Android code in IntelliJ IDEA {:#edit-android-code}
## 在 IntelliJ IDEA 中编辑 Android 代码
To enable editing of Android code in IntelliJ IDEA, you need to configure the
location of the Android SDK:
要在 IntelliJ IDEA 中编辑 Android 代码,你需要配置 Android SDK 的位置:
1. In **Preferences > Plugins**, enable **Android Support** if you
haven't already.
在 **Preferences > Plugins** 中,启用 **Android Support**。
1. Right-click the **android** folder in the Project view, and select **Open
Module Settings**.
在项目视图中,右键点击 **android** 文件夹,然后选择 **Open
Module Settings**。
1. In the **Sources** tab, locate the **Language level** field, and
select level 8 or later.
在 **Sources** 选项中,找到 **Language level**,并选择 level 8 或更高级别。
1. In the **Dependencies** tab, locate the **Module SDK** field,
and select an Android SDK. If no SDK is listed, click **New**
and specify the location of the Android SDK.
Make sure to select an Android SDK matching the one used by
Flutter (as reported by `flutter doctor`).
在 **Dependencies** 选项中,找到 **Module SDK**,并选择一个 Android SDK。
如果这里没有列出 SDK,点击 **New** 并指定 Android SDK 的位置。
确保选择和 Flutter 使用相匹配的 Android SDK(如 `flutter doctor` 中所示)。
1. Click **OK**.
点击 **OK**。
## Flutter Property Editor {: #property-editor}
## Flutter 属性编辑器 (Property Editor)
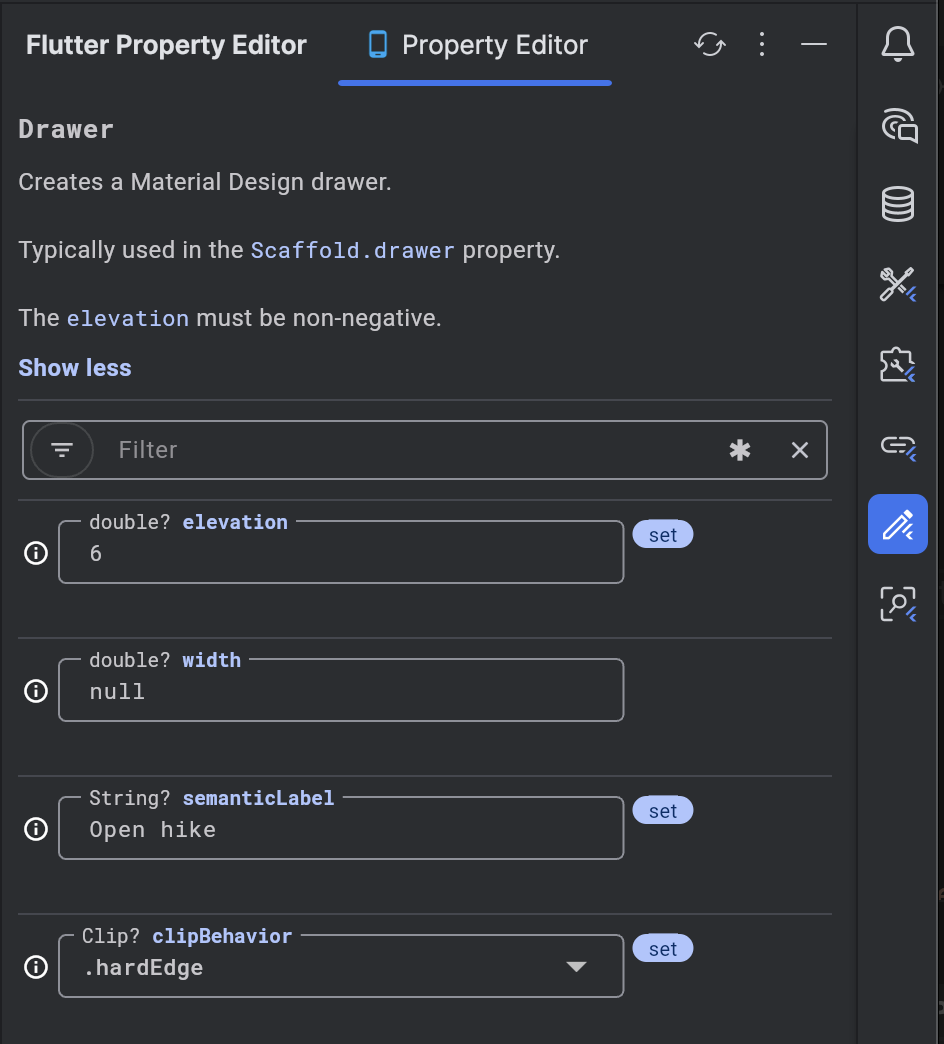
The Flutter Property Editor is a powerful tool provided by the [Flutter
plugin][] that lets you view and modify widget properties directly from its
visual interface.
Flutter 属性编辑器是由 [Flutter 插件][Flutter plugin] 提供的强大工具,
让你可以直接在其可视化界面中查看和修改 widget 属性。
### How to open the Flutter Property Editor in Android Studio and IntelliJ
### 如何在 Android Studio 和 IntelliJ 中打开 Flutter 属性编辑器
1. Click on the Flutter Property Editor **icon** {:width="20px"} in the Android Studio or IntelliJ sidebar.
点击 Android Studio 或 IntelliJ 侧边栏中的 Flutter 属性编辑器 **图标** {:width="20px"}。
2. The Flutter Property Editor will load in the side panel.
Flutter 属性编辑器将在侧边面板中加载。
3. Please refer to the Flutter Property Editor [documentation][] for a detailed usage guide.
请参阅 Flutter 属性编辑器 [文档][documentation] 以获取详细的使用指南。
{:width="600px"}
[Flutter plugin]: https://plugins.jetbrains.com/plugin/9212-flutter
[documentation]: /tools/property-editor
## Troubleshooting
## 故障排除
### Known issues and feedback
### 已知问题和反馈
Important known issues that might impact your experience are
documented in the [Flutter plugin README][] file.
[Flutter 插件 README][Flutter plugin README]
文件中记录了可能影响你使用体验的已知重要问题。
Known bugs and feature requests are tracked in the issue trackers:
已知问题和功能请求都会在以下进行跟踪:
* [Flutter plugin issue tracker][]
[Flutter 插件问题跟踪][Flutter plugin issue tracker]
* [Dart plugin issue tracker][]
[Dart 插件问题跟踪][Dart plugin issue tracker]
We welcome feedback, both on bugs/issues and feature requests.
Prior to filing new issues:
我们欢迎所有的错误、问题以及功能反馈。
在提交新问题前需要注意:
* Do a quick search in the issue trackers to
see if the issue is already tracked.
在问题跟踪器中快速搜索查看问题是否已存在。
* Make sure you have [updated](#updating) to
the most recent version of the plugin.
确保你已经 [更新](#updating) 最新版本的插件。
When filing new issues, include the output of [`flutter doctor`][].
当你在提交新的 issue 时,确保带上运行了 [`flutter doctor`][] 命令之后的返回内容。
[DevTools]: /tools/devtools
[Flutter plugin issue tracker]: https://github.com/flutter/flutter-intellij/issues
[Dart plugin issue tracker]: https://github.com/flutter/dart-intellij-third-party/issues
[`flutter doctor`]: /resources/bug-reports#provide-some-flutter-diagnostics
[Debugging Flutter apps]: /testing/debugging
[Flutter plugin README]: https://github.com/flutter/flutter-intellij/blob/master/README.md
["project view"]: https://developer.android.google.cn/studio/projects/#ProjectView
[let us know]: https://github.com/cfug/flutter.cn/issues/new
[Running DevTools from Android Studio]: /tools/devtools/android-studio
[Hot reload]: /tools/hot-reload
[Timeline view]: /tools/devtools/performance